
I joined Geographical Information Science Lab in the Department of Geography in National Taiwan University. My academic supervisor is Professor Tzai-Hung Wen, Ph.D.
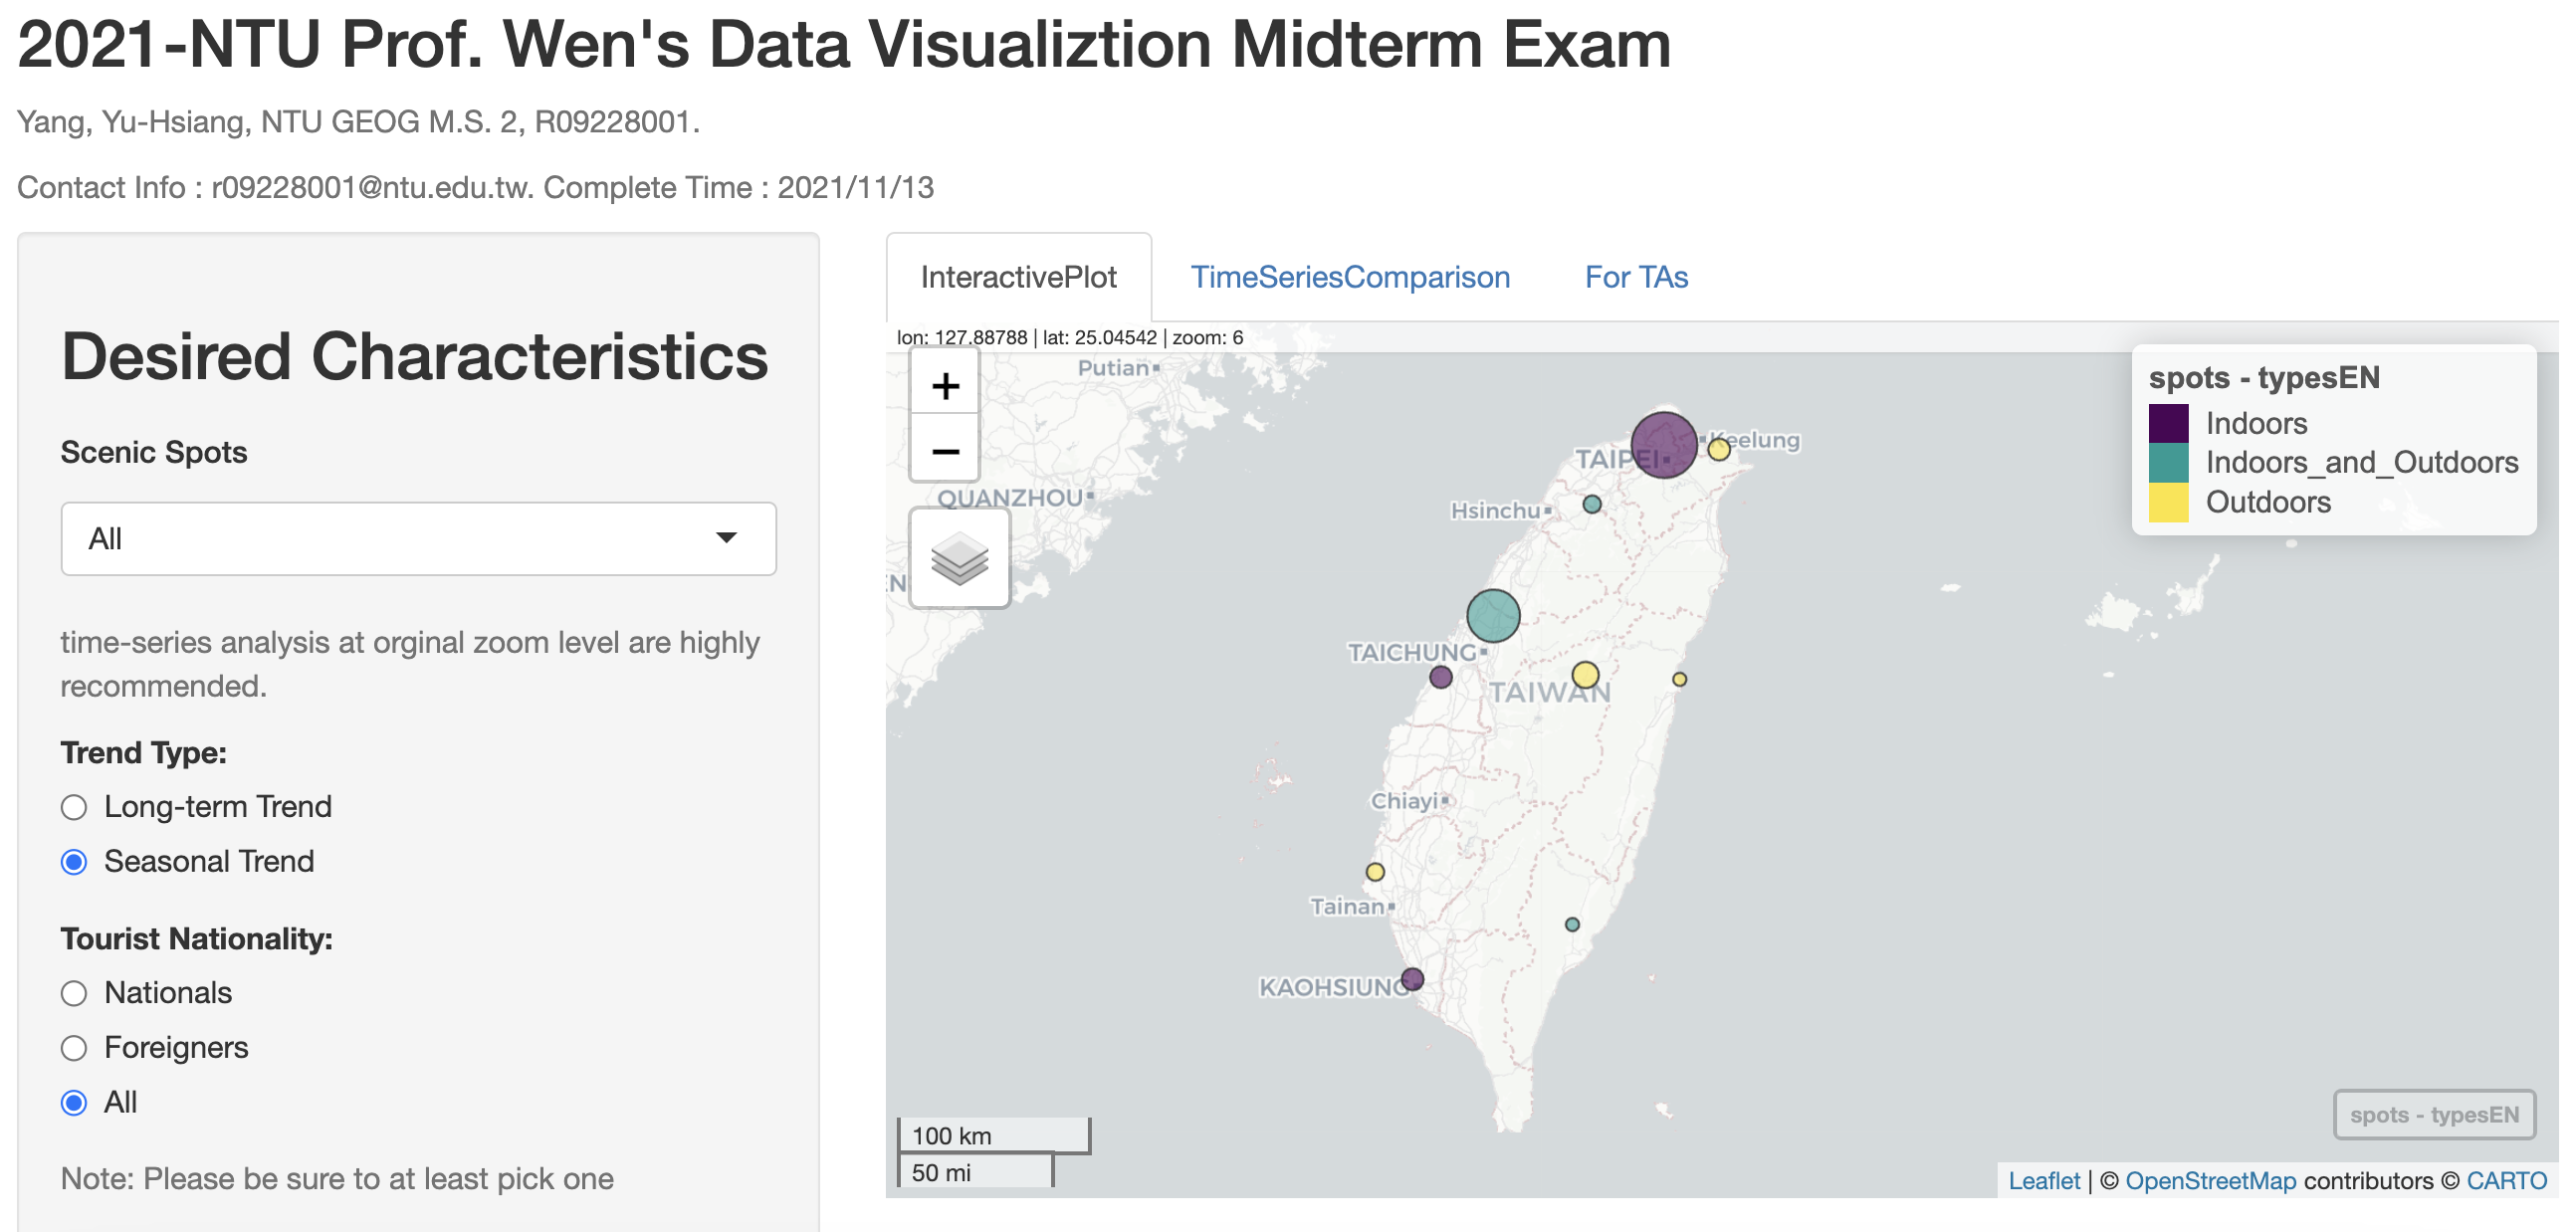
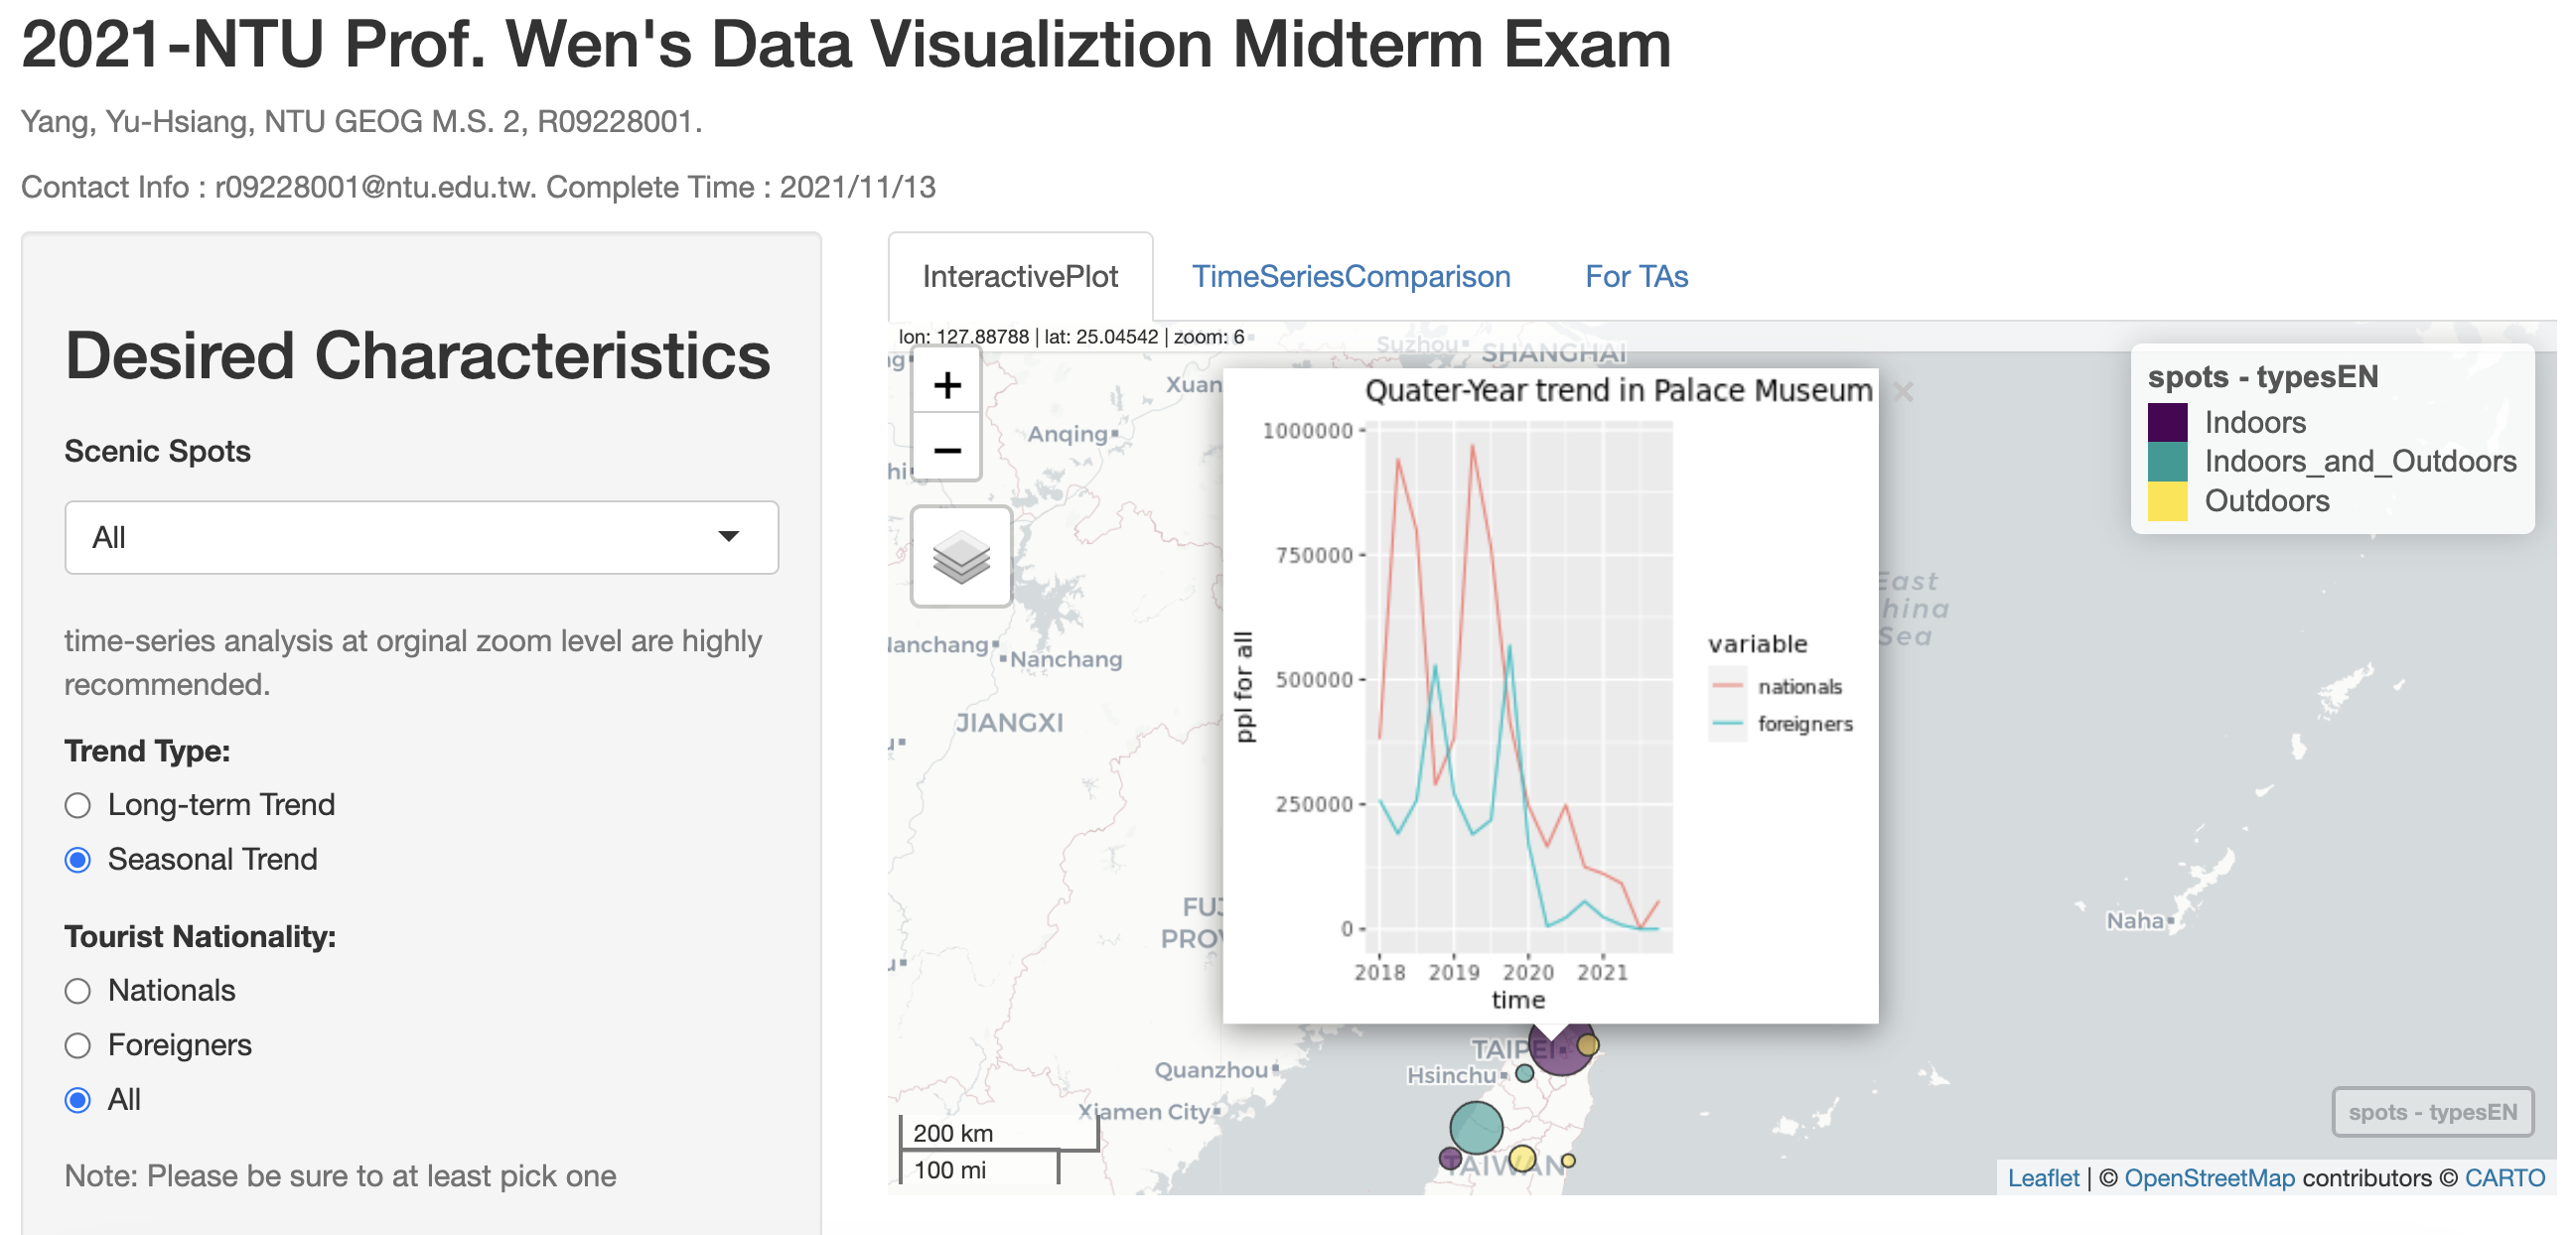
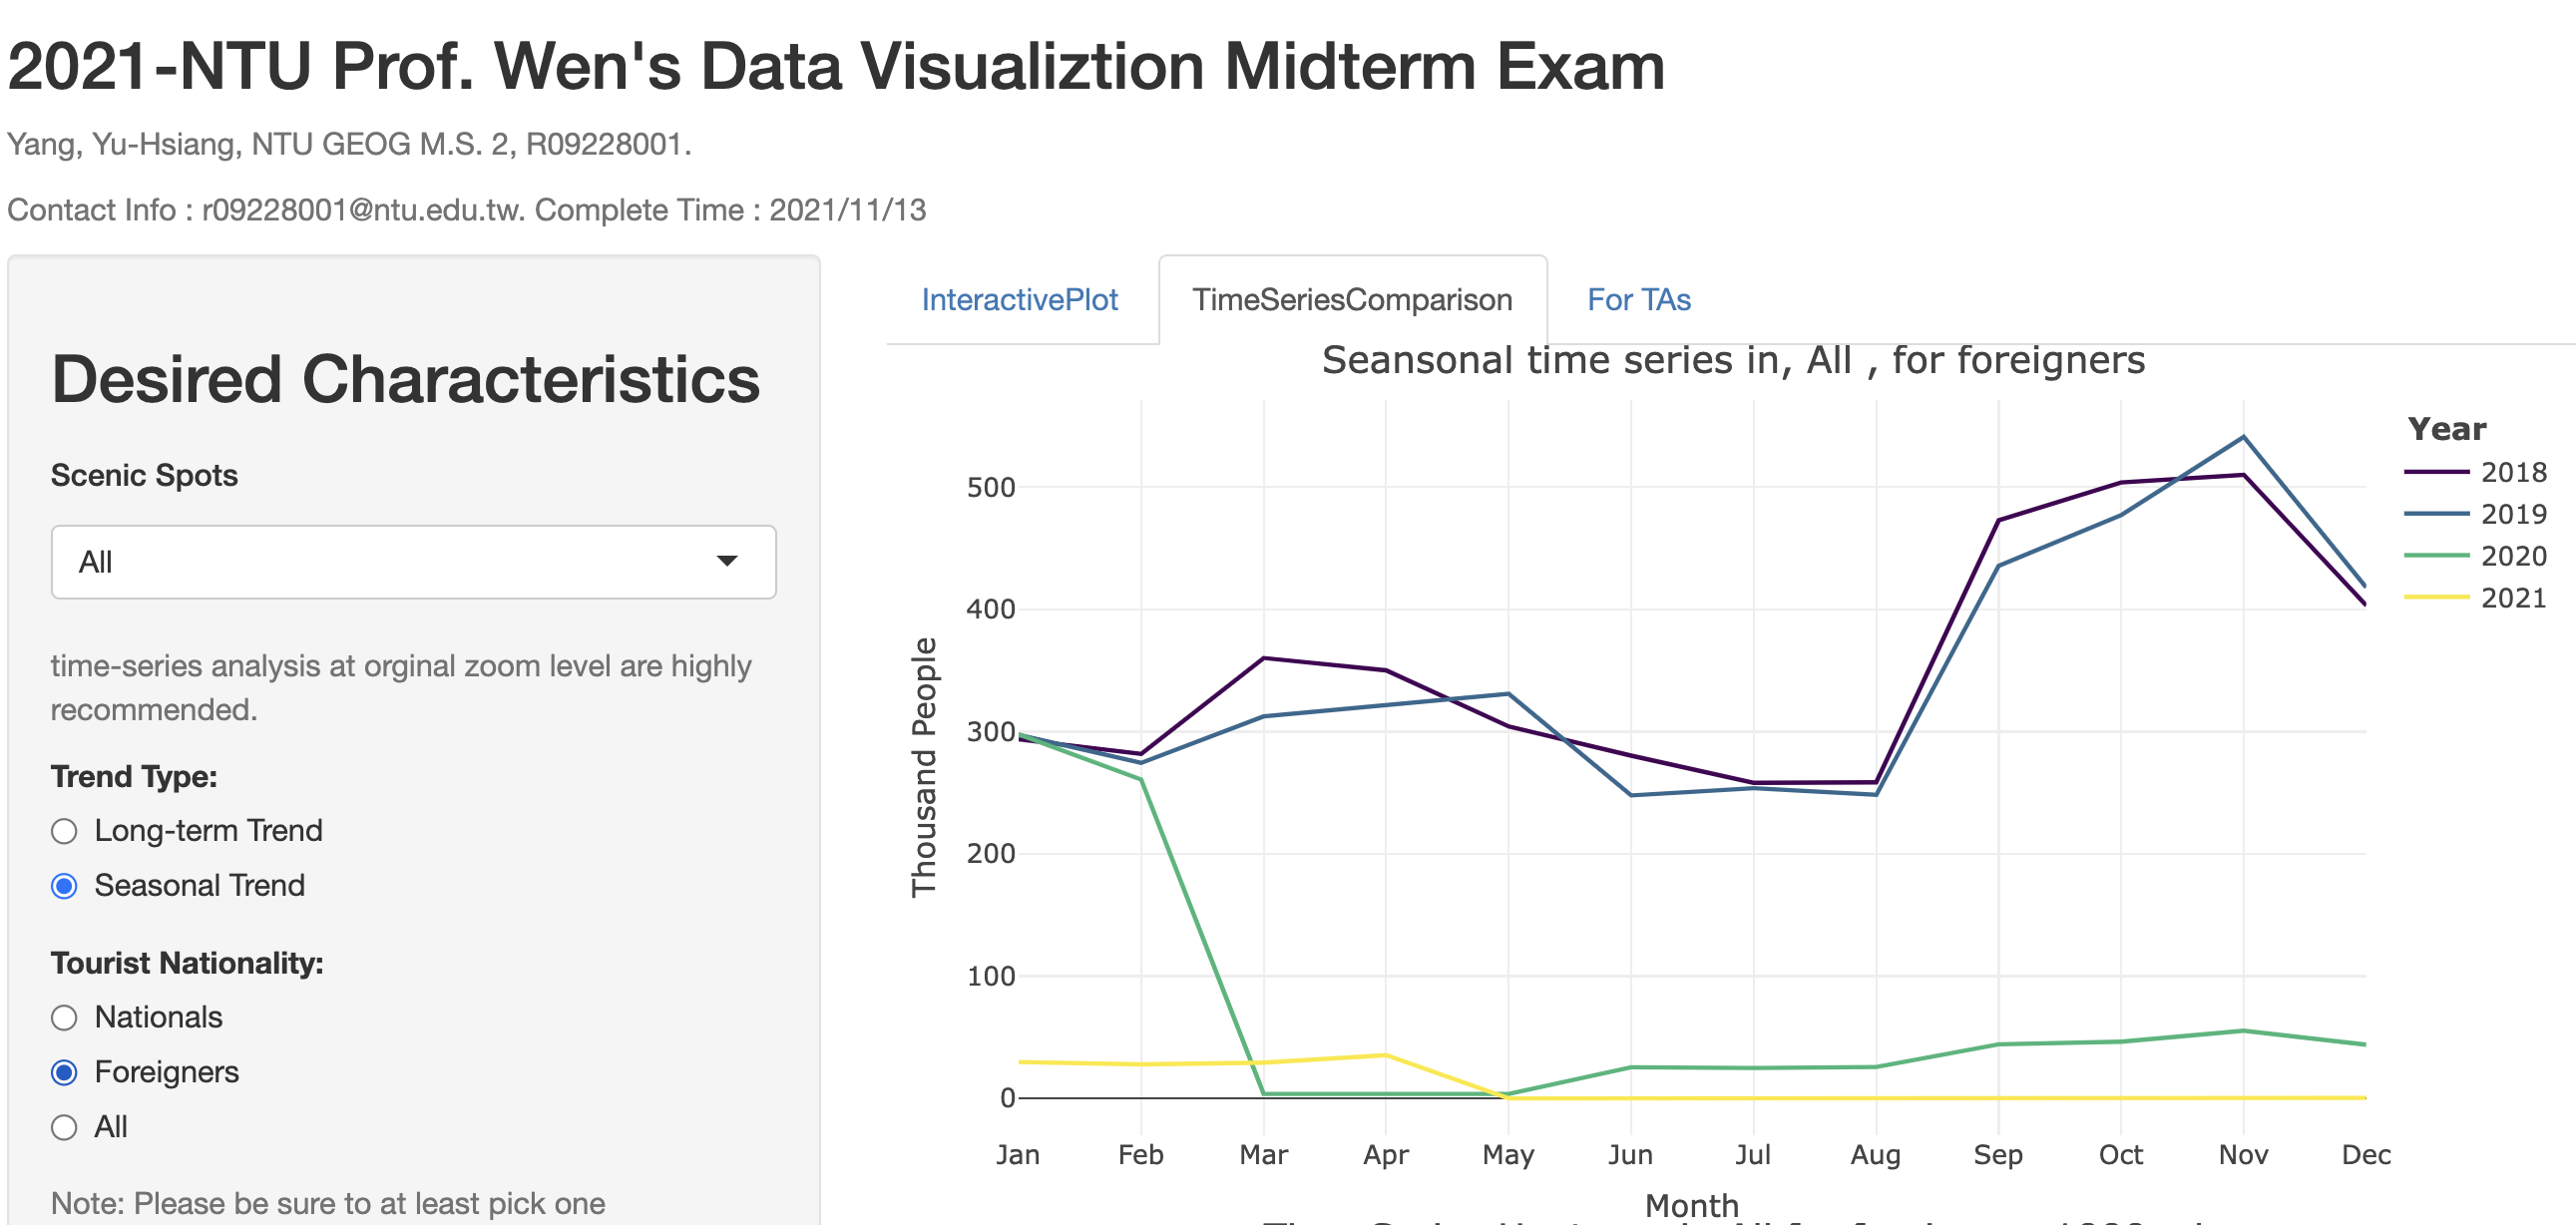
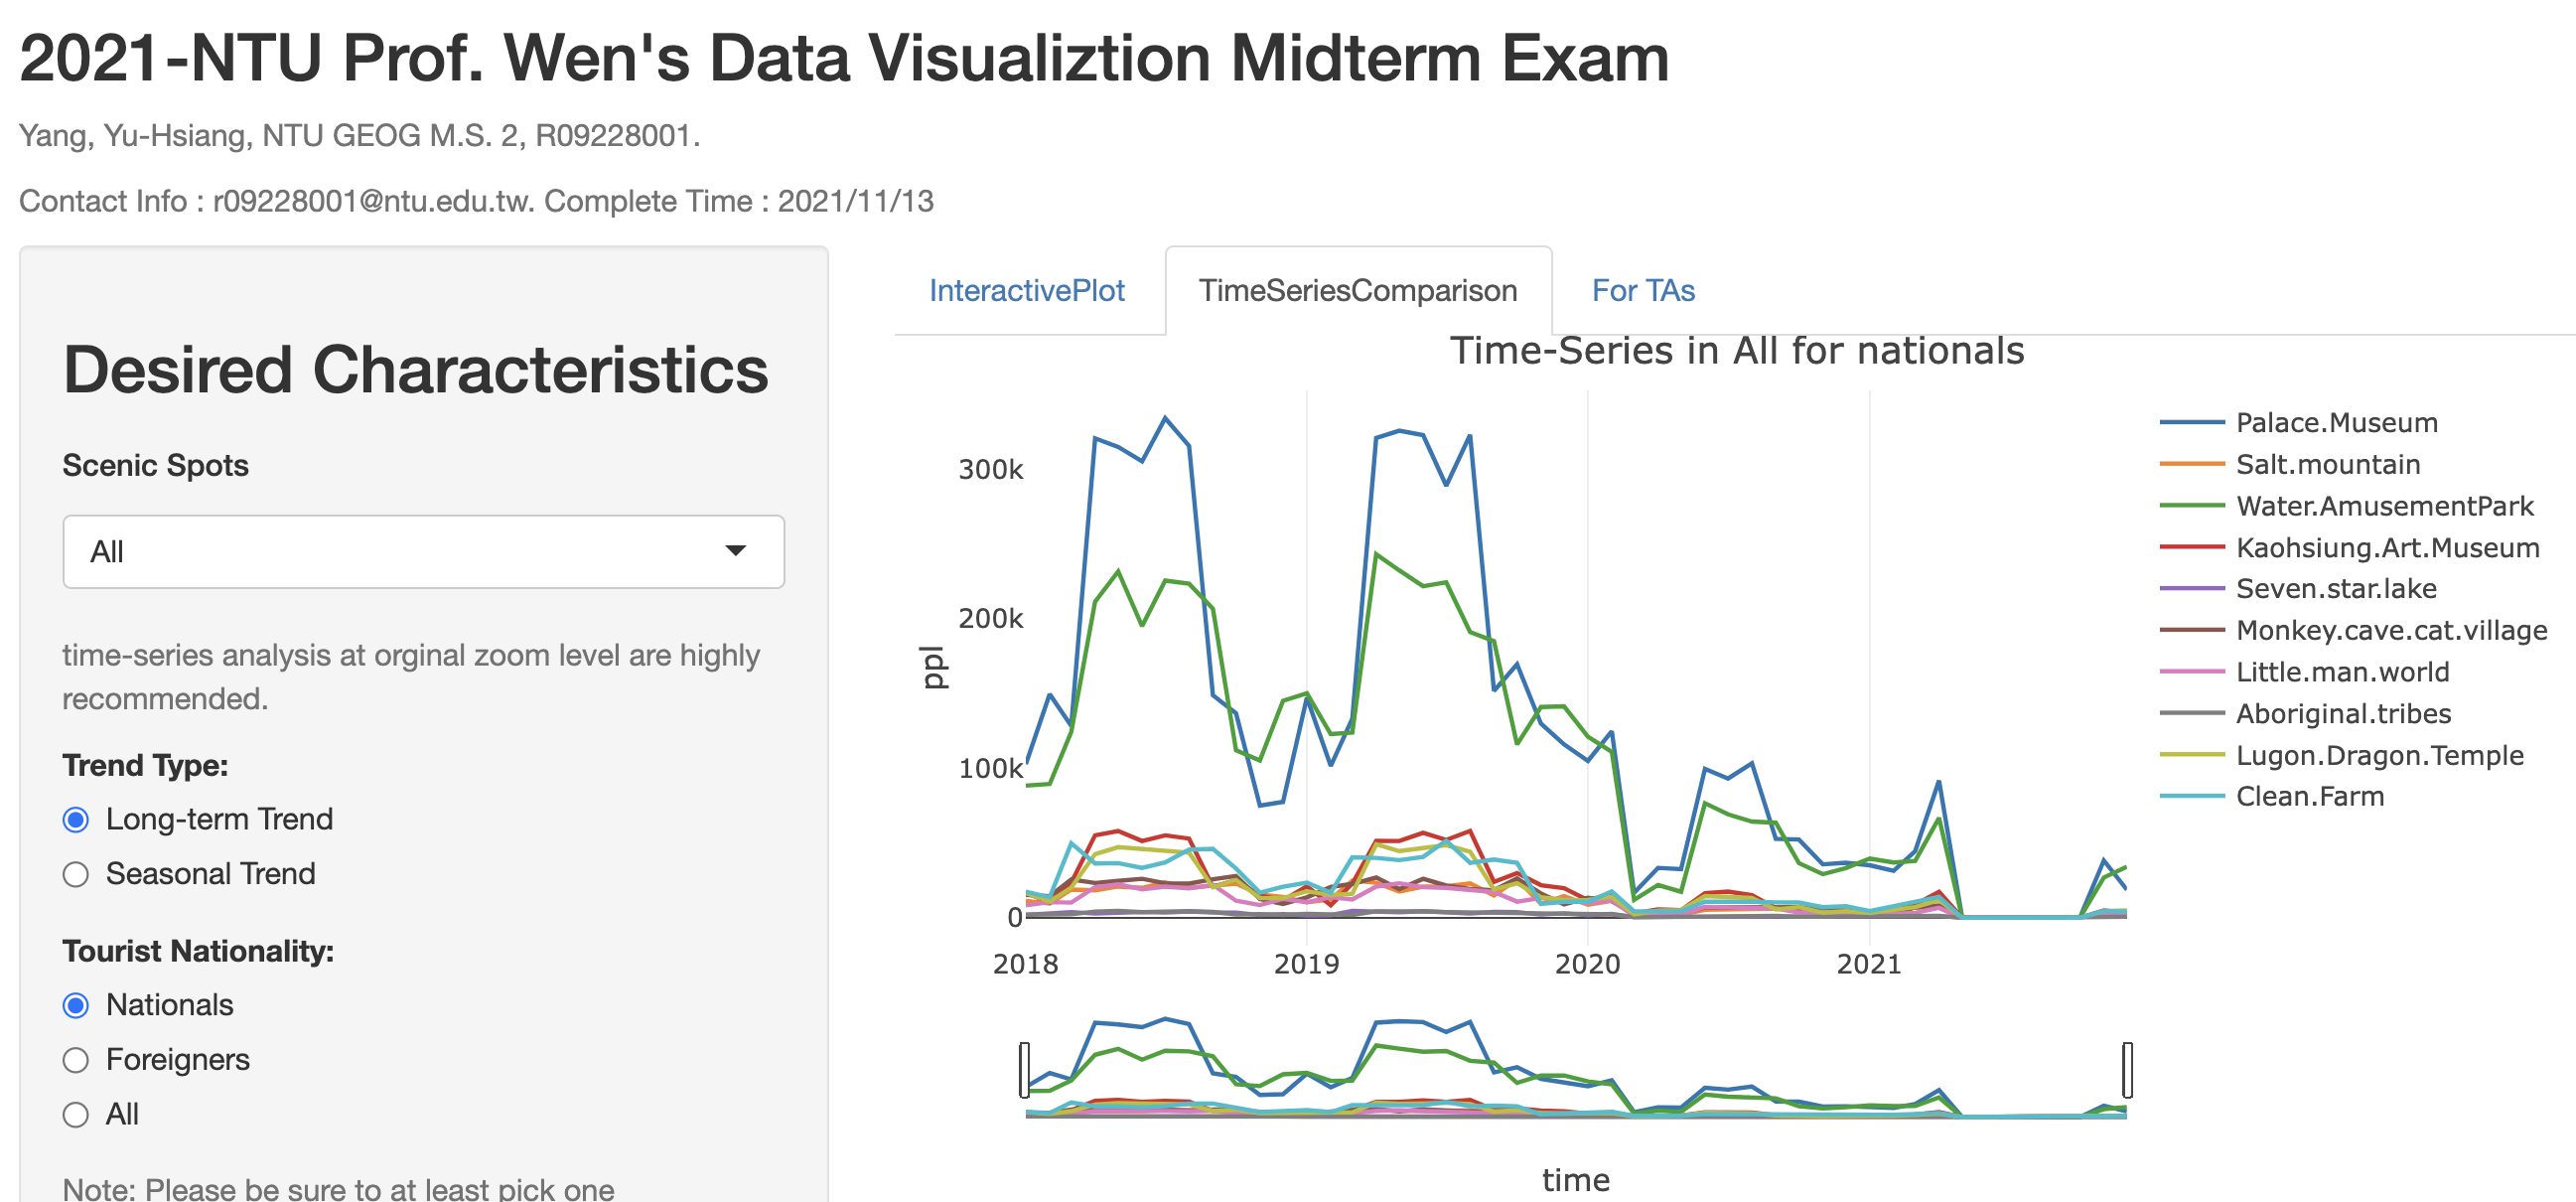
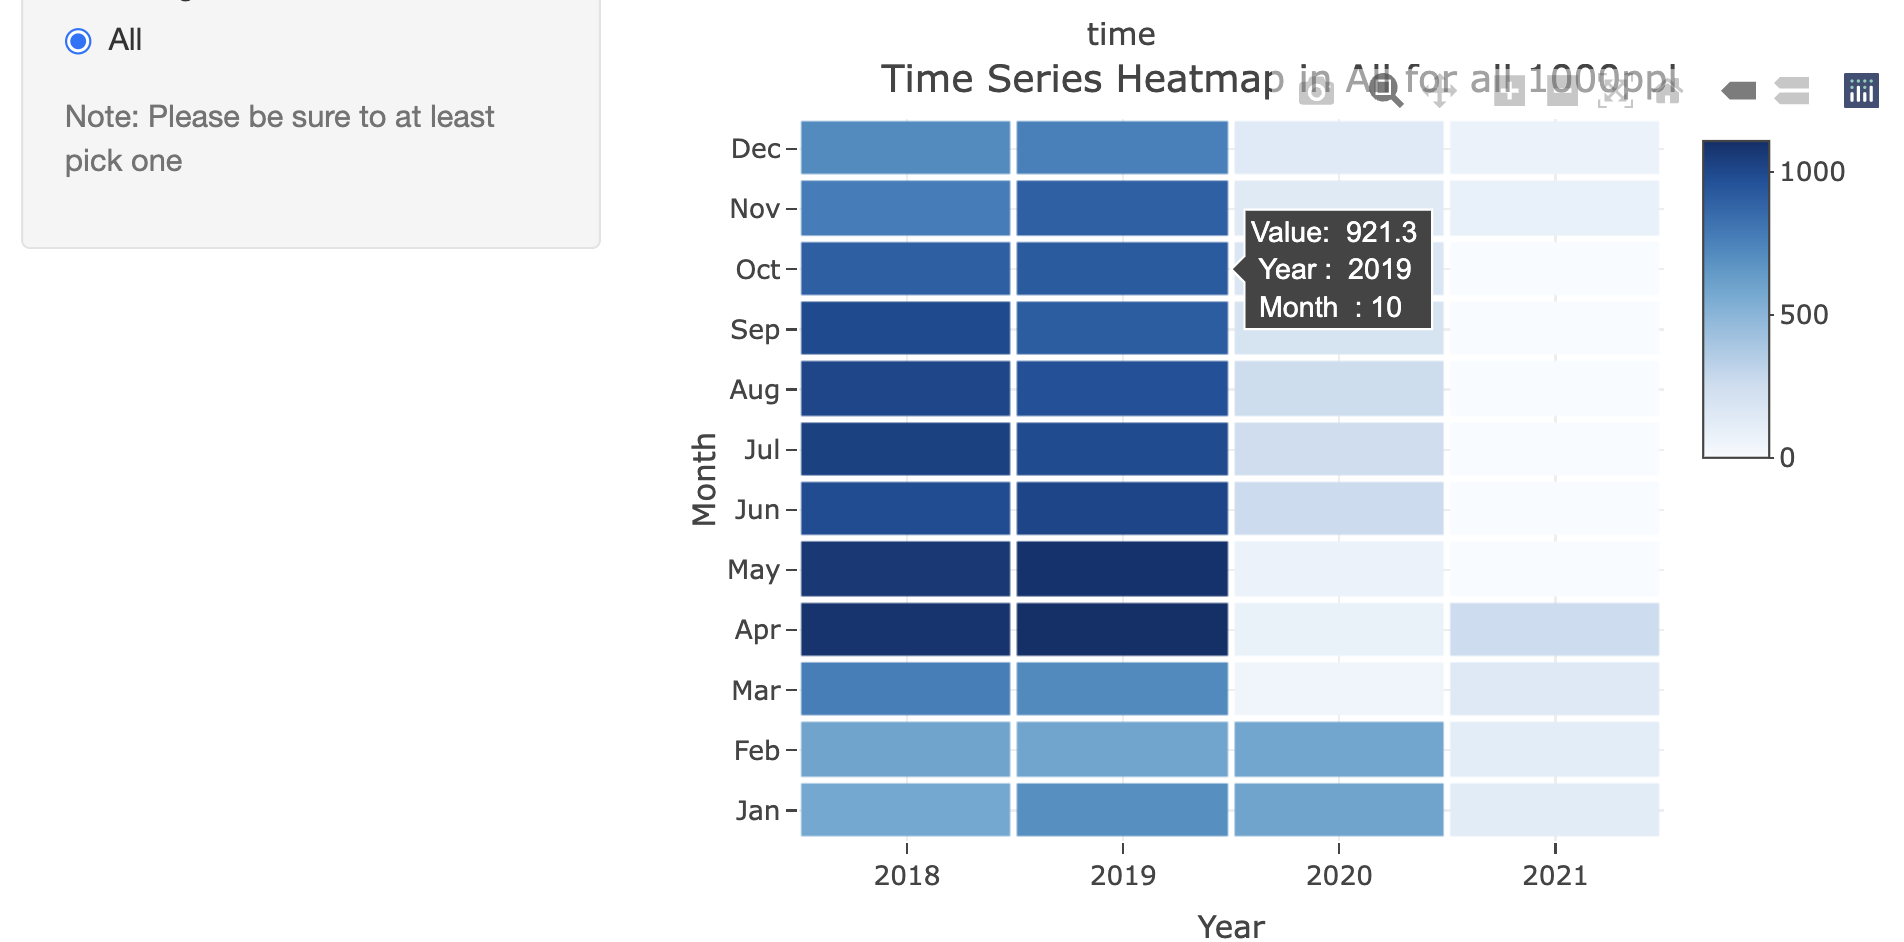
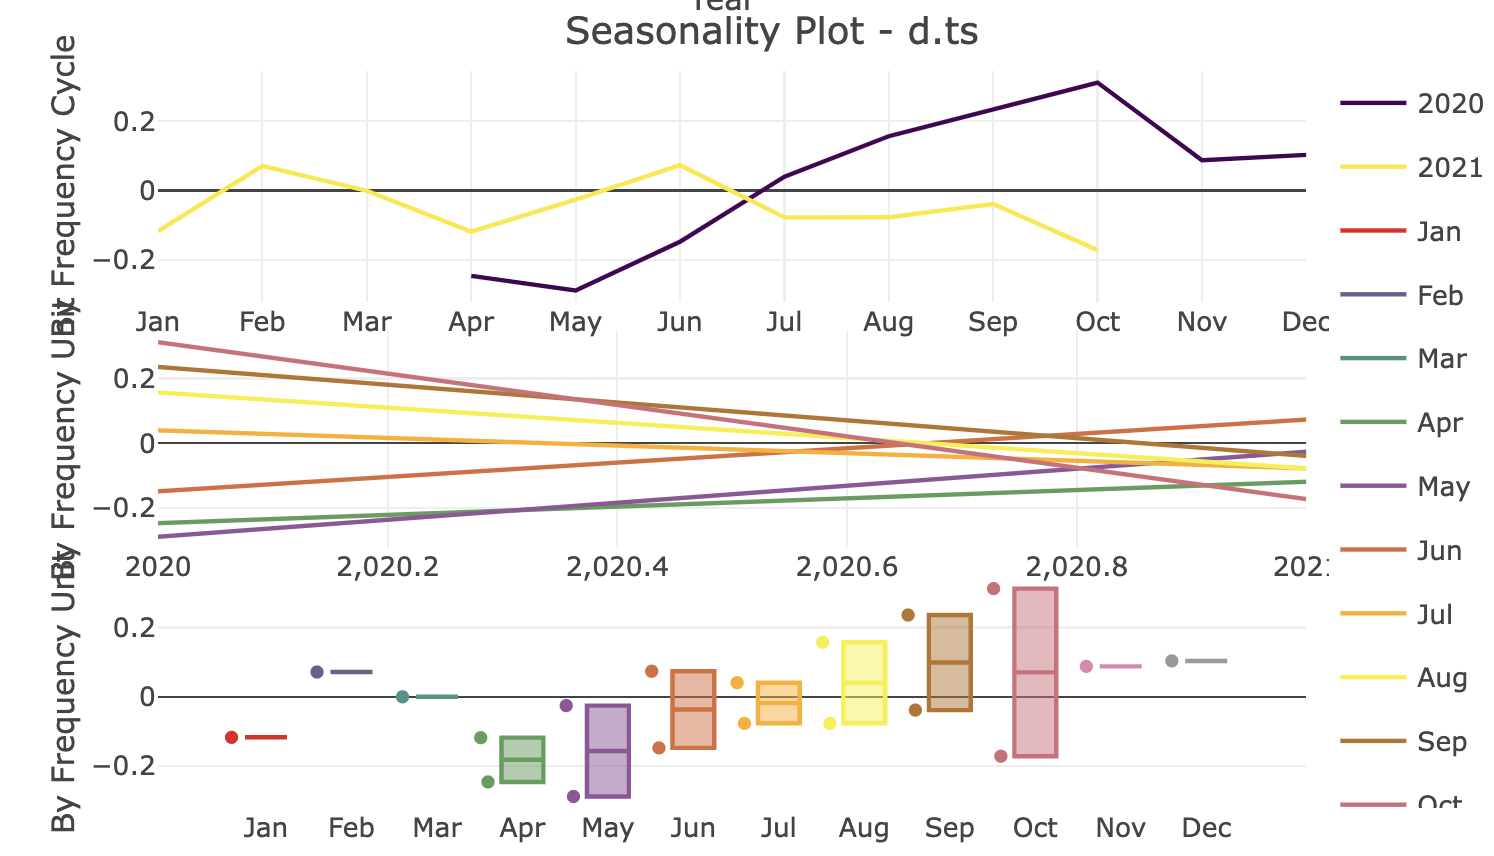
This work use R langauge with shiny package to conduct a user-control shiny App. In this work, the theme is Taiwan Tourism Data.In order of compare the seasonality of visitors in different tourist spots, I generated the seasonal plots and heat maps for seasonality of time series respectively on my webpage link. When we compare 10 tourist spots, for Palace Museum, April-May seems as a popular season; for salt mountain, June-Aug and Nov.-Feb seems to be popular seasons; for water amusement park, April-May seems to be a popular season; for Kousiung art museum, April and may seems to be a popular season; for seven star lake, June-Aug seems to be a popular season; for monkey cave cat village, June-Aug seems to be a popular season ; for little man world, April and may seems to be a popular season; for Aboriginal tribes, April and may seems to be a popular season and for Lugon dragon temple, April-Octobers seems to be a popular long season and finally, for clean farm, June-Aug seems to be a popular season . Overall, the spring vacation and summer vacation appear to be the high spot seasons for visitors in these tourist spots (refer to Appendix).
2021-1 R Shiny App Project 1: Taiwan Tourism Data Spatiotemperal Analysis
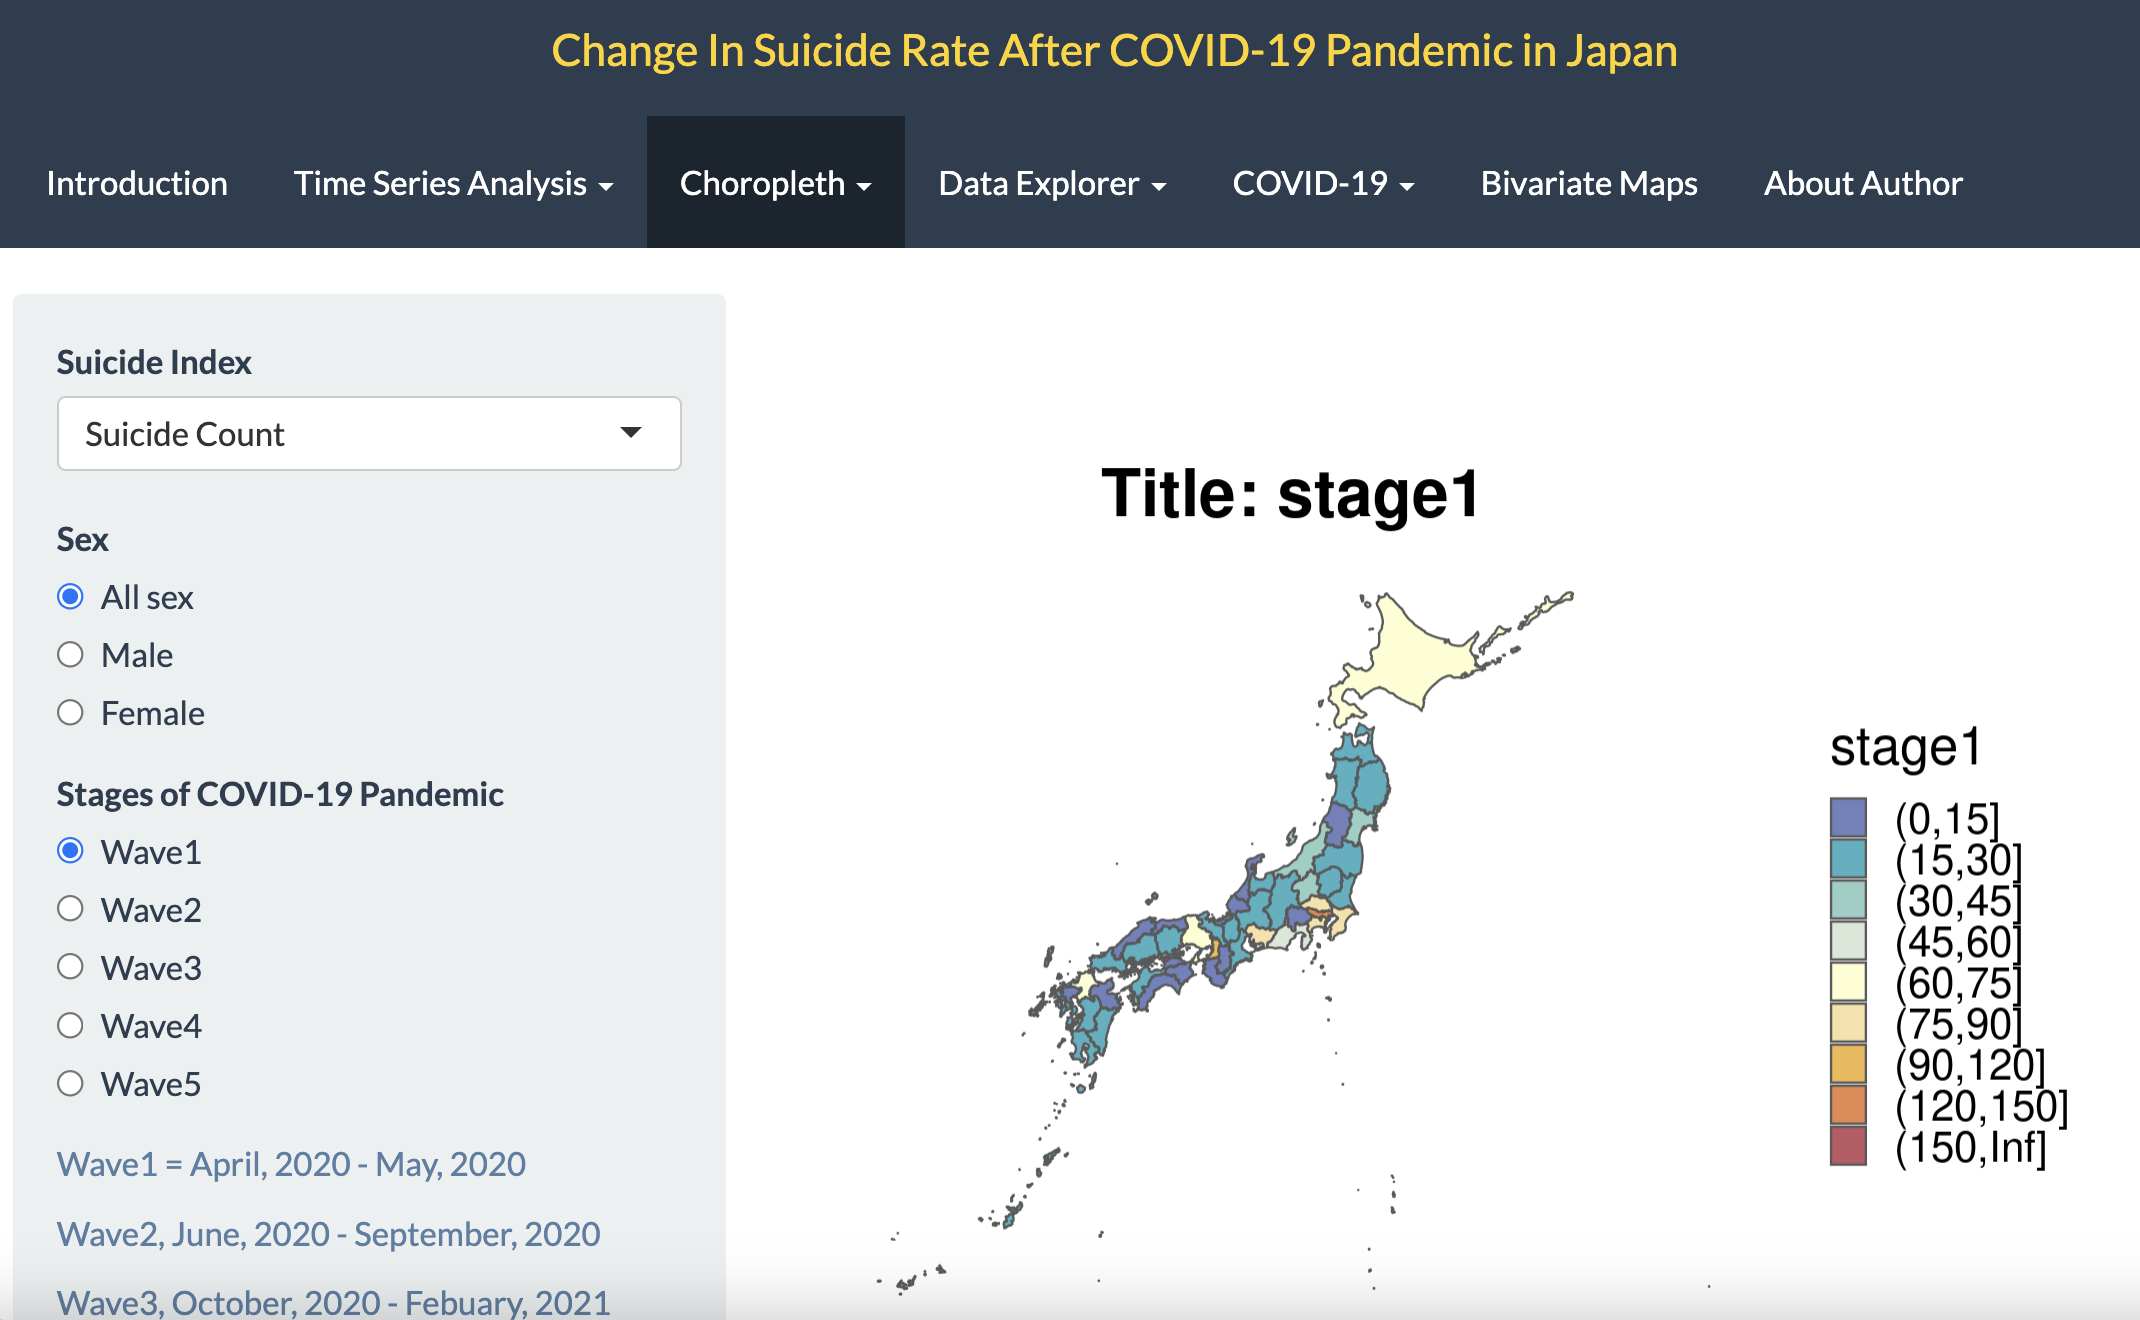
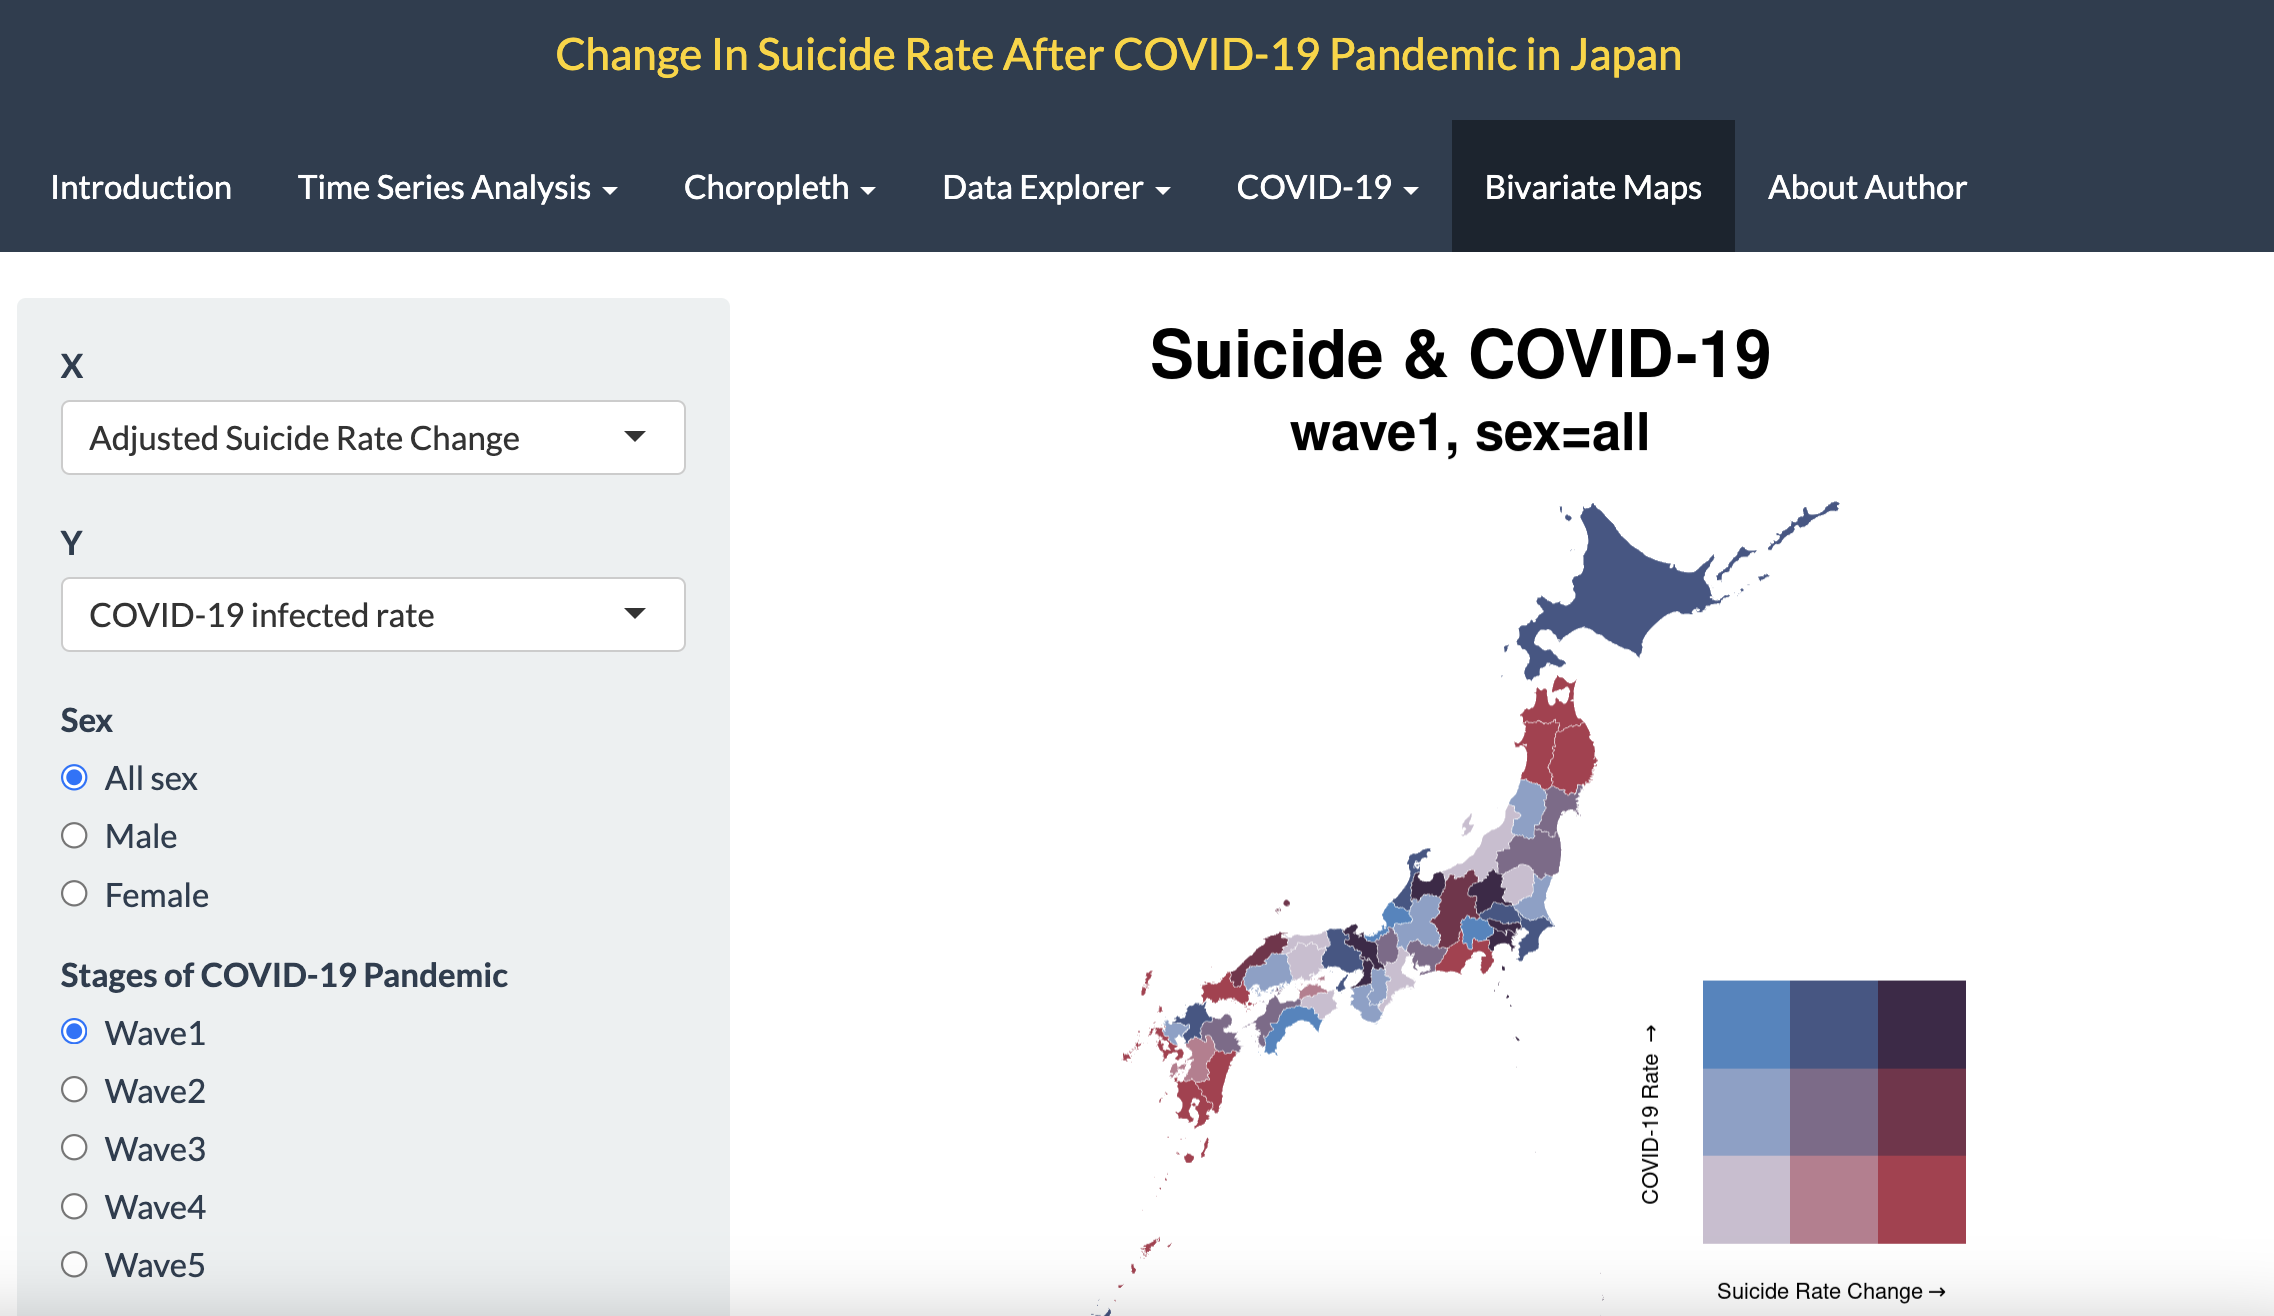
It has been reported that COVID-19 influenced human’s mental condition via a variety of aspect including fear of being infected, loneliness during self-quarantine and so on. In Japan, it has been reported that there were excessive suicide rate than the stable condition before the virus outbreak (Tanaka, T., Okamoto, S., 2021). However, the spatial pattern of COVID-19 induced suicide rate change wasn’t been discussed. Accordingly, I am going to discuss the spatial pattern of suicide rate change in the 5 waves of COVID-19 outbreak in Japan.
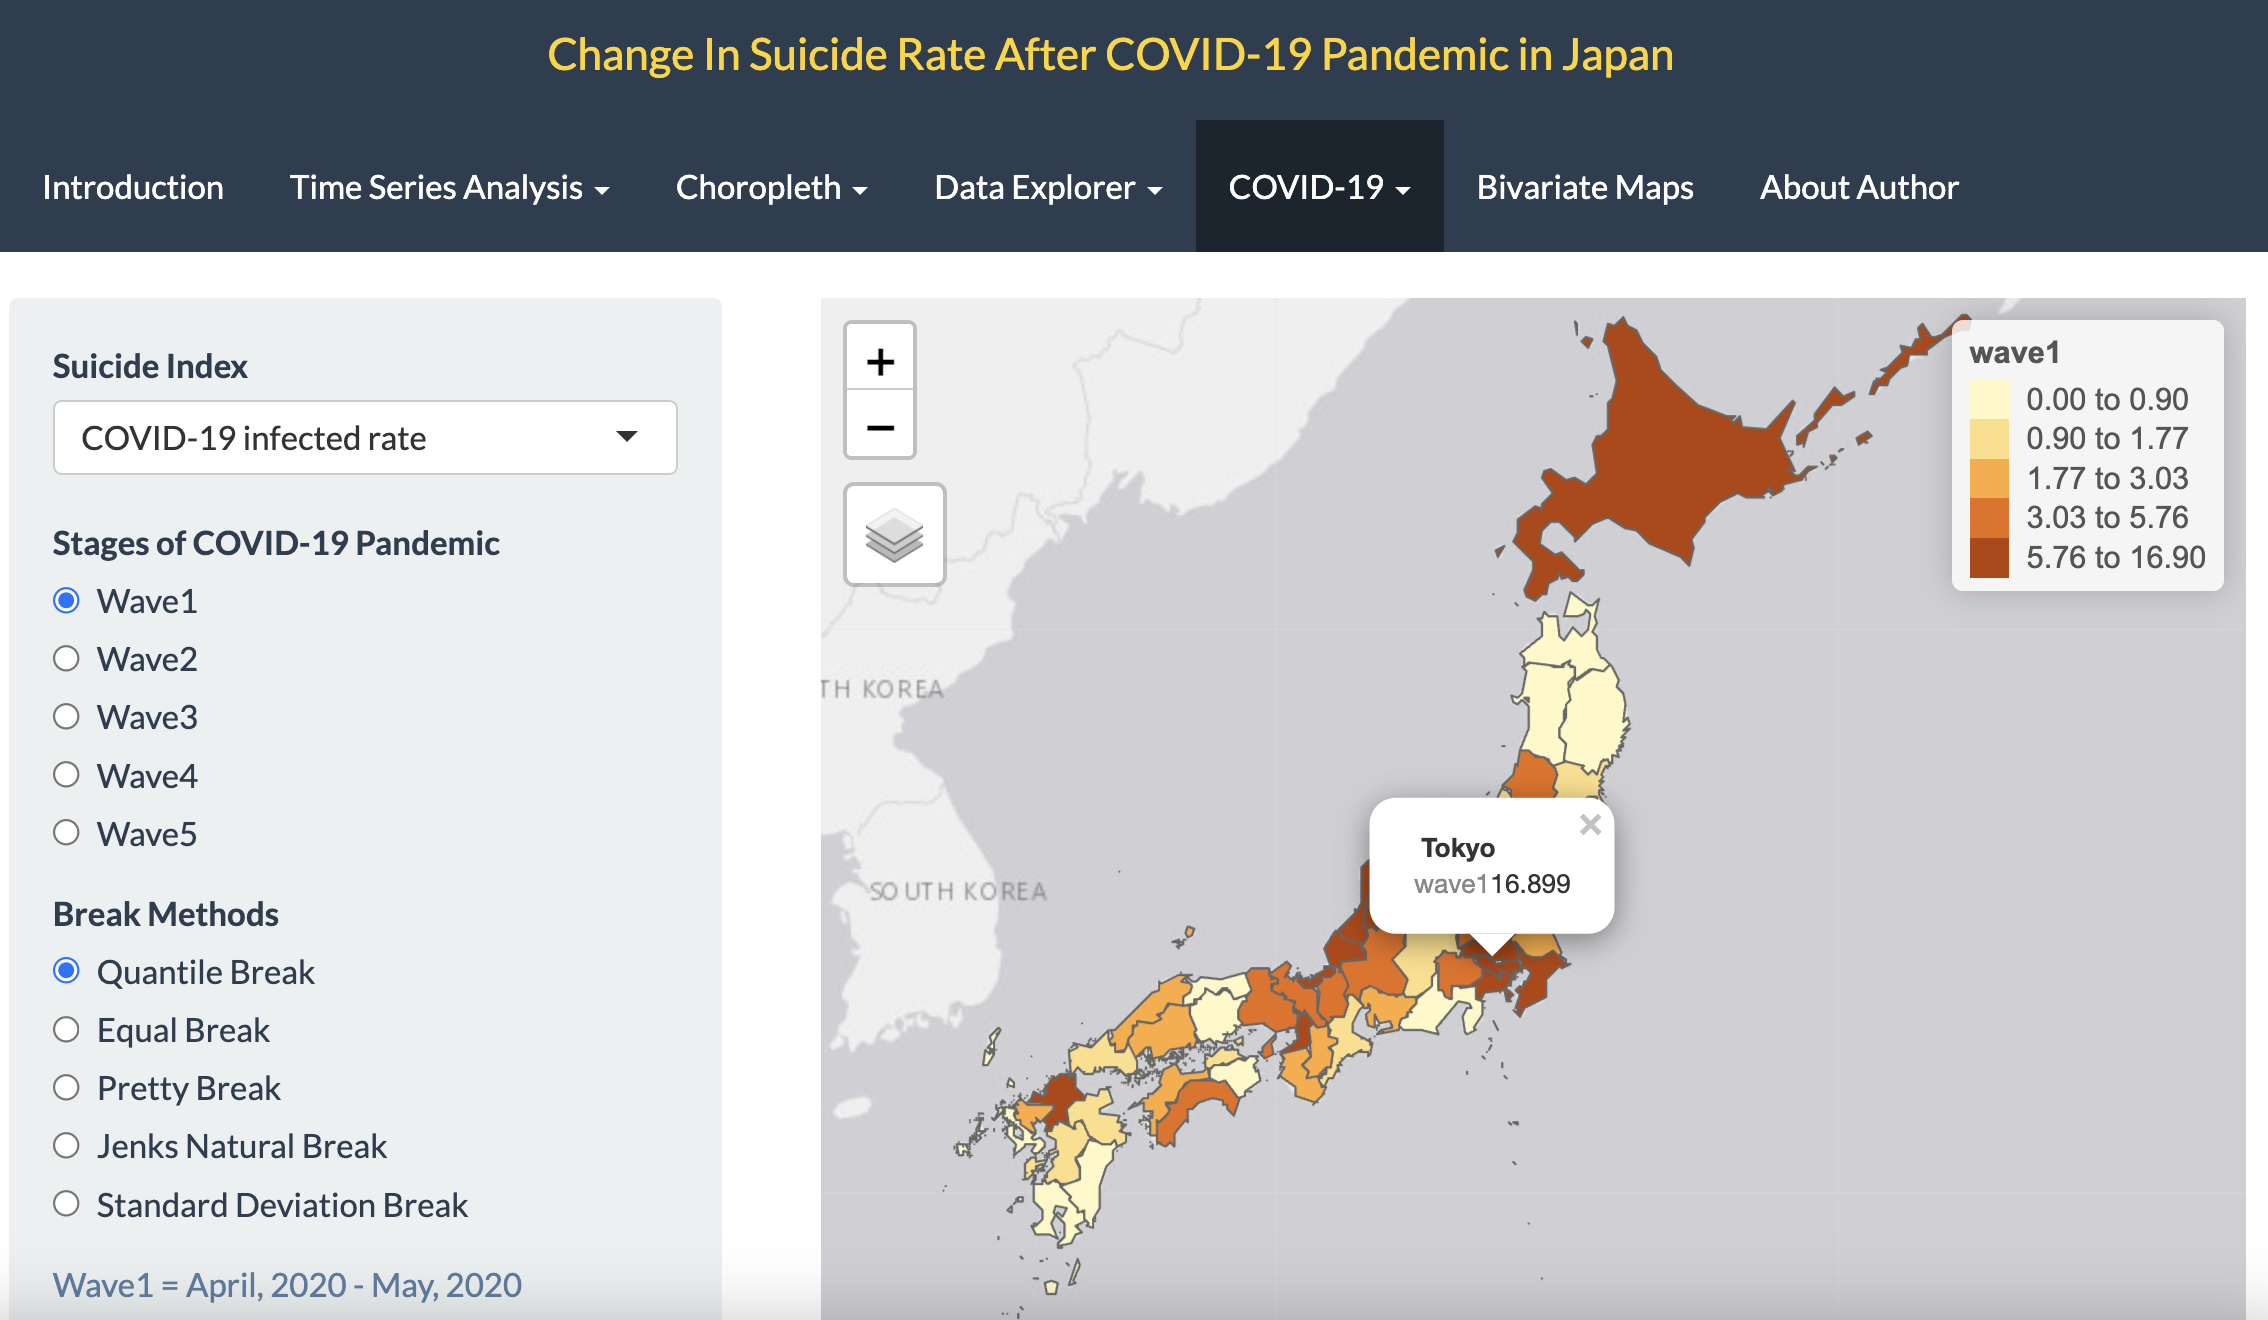
Hence, I wonder 1. What is the spatial pattern of changes in suicide rate after COVID-19 in Japan ? 2. Do places with more serious COVID-19 have more increasing suicide rate ?
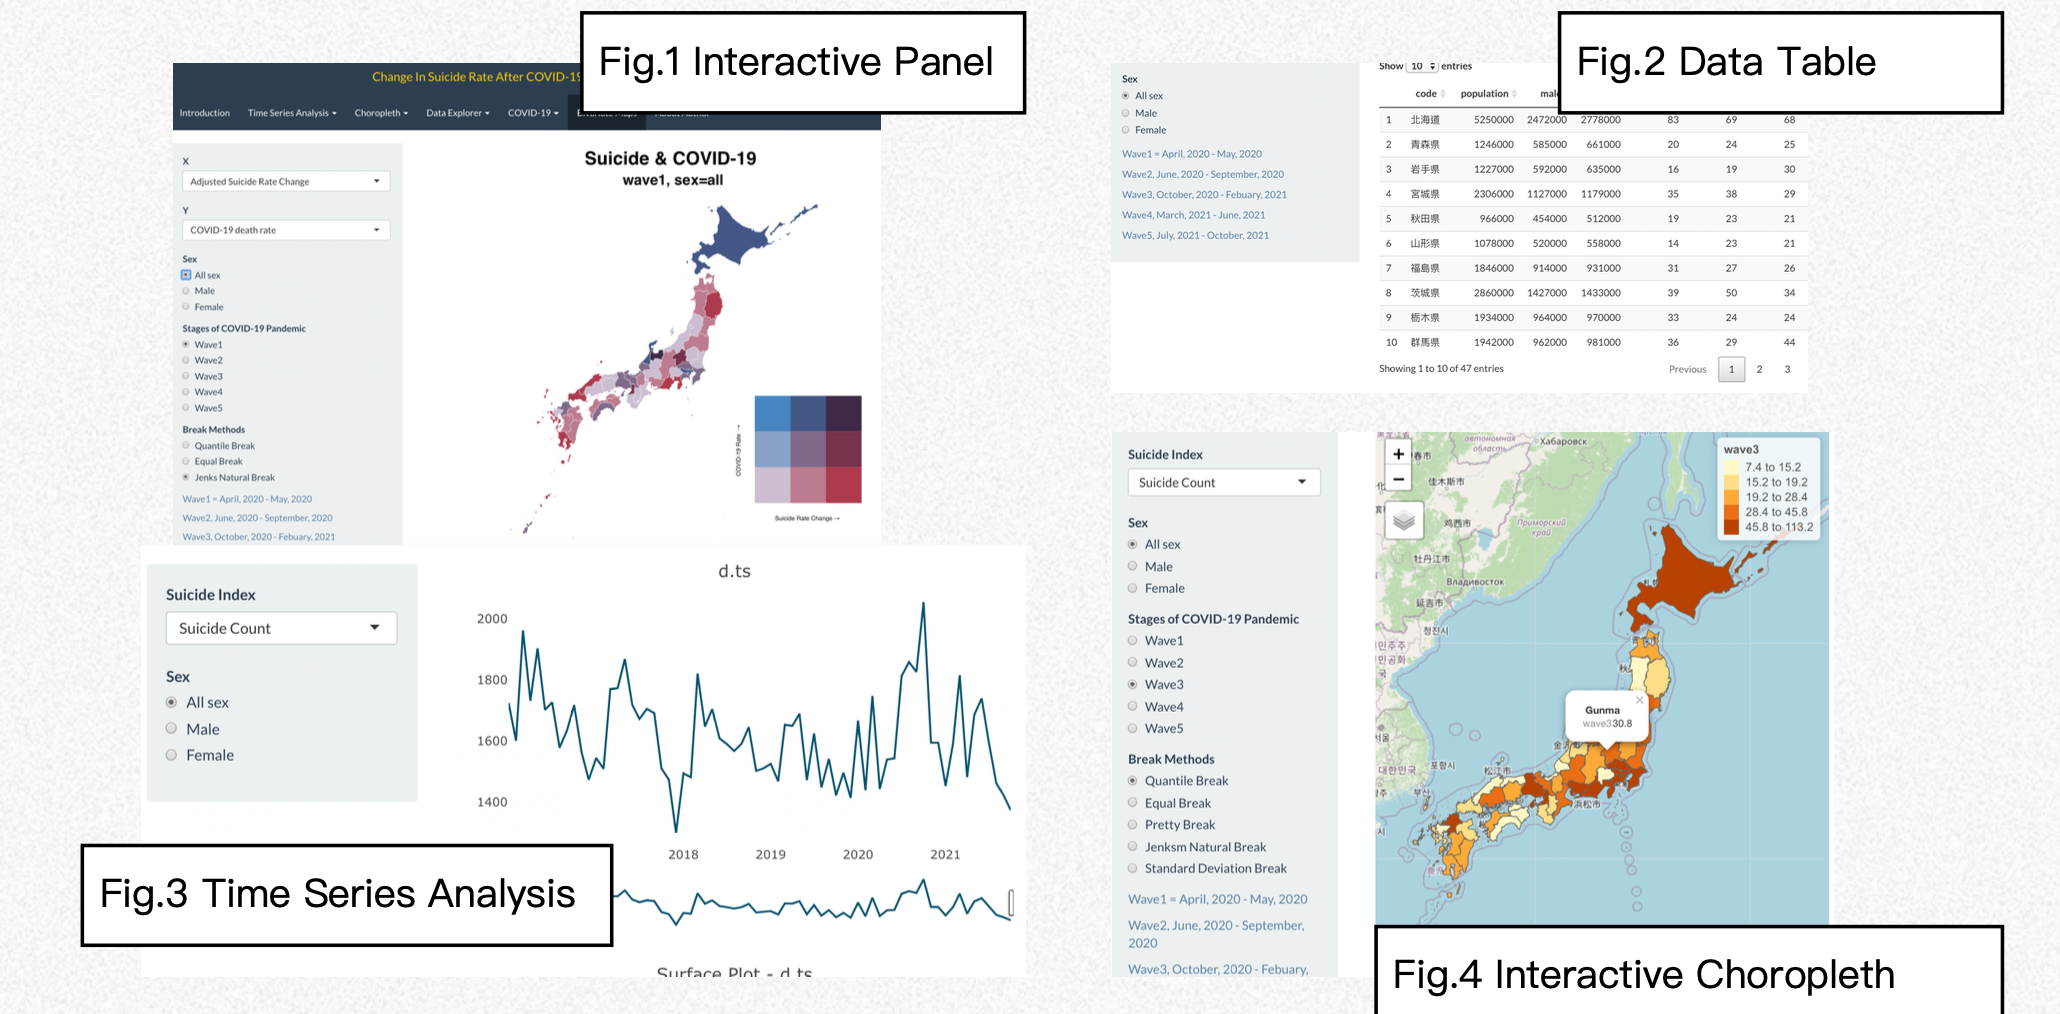
As the result, I created several panels in my pages. Firstly, Introduction panels is for introduce 47 prefecture locations in Japan. Secondly, I showed time series of suicide count, suicide rate, change in suicide rate, adjusted change in suicide rate. Thirdly, Choropleths were made to investigate the spatial pattern of suicide index. Fourthly, data table with both suicide and COVID-19 are available on my page. Fifthly, time series and choropleth of COVID-19 infected and death were plotted.
2021-1 R Shiny App Project Project 2: Spatal Patterns of Change in Suicide rate after COVID-19 in Japan
I joined Geographical Information Science Lab in the Department of Geography in National Taiwan University. My academic supervisor is Professor Tzai-Hung Wen, Ph.D.
Any cooperation or suggestion is welcome to me. E-mail is on school system. Phonenumer and the Address is Geography Department of National Taiwan University
Since 7,August 2019 (Wed)