
I joined Geographical Information Science Lab in the Department of Geography in National Taiwan University. My academic supervisor is Professor Tzai-Hung Wen, Ph.D.
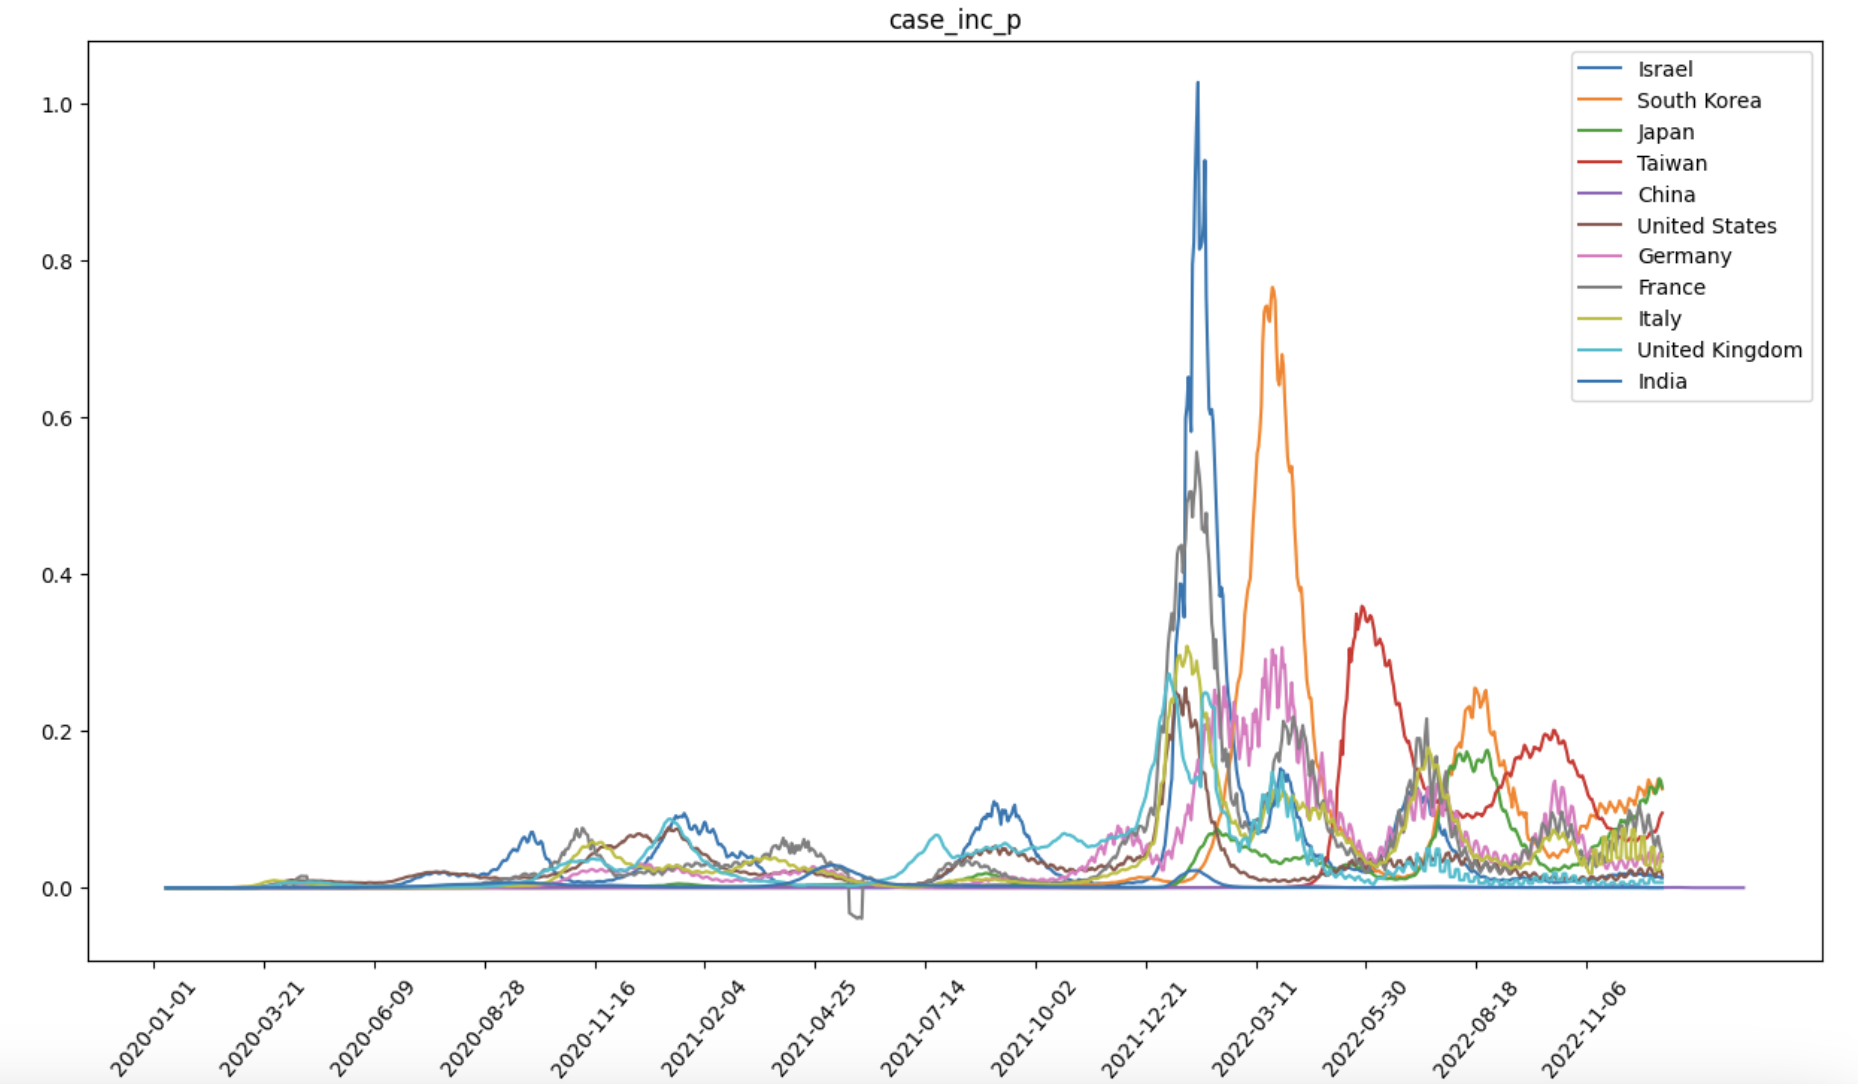
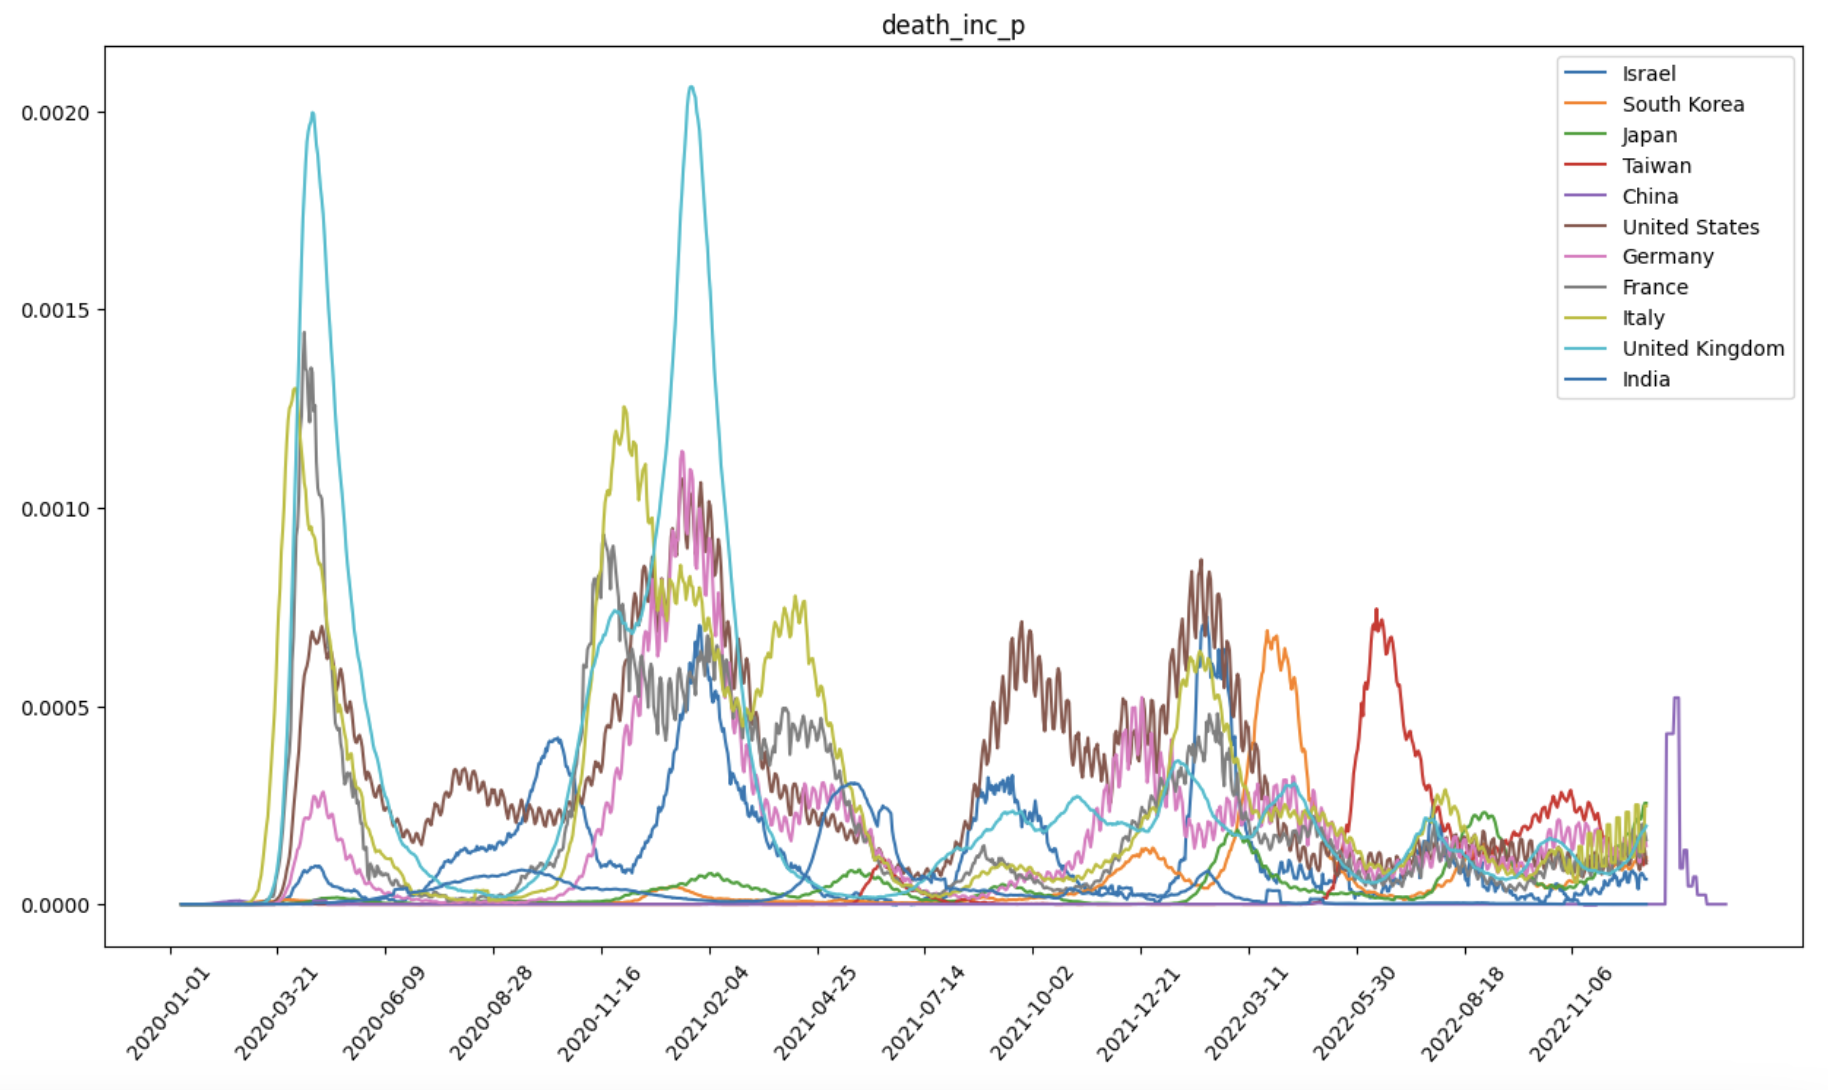
This is a graphical representation of the time trend of the outbreak by using DataFrame to organize data from the COVID-19 GOVERNMENT RESPONSE TRACKER website in a classroom at the National Taiwan University. The information on the epidemic is combined with the economic and social backgrounds of various countries around the world to make the information more complete.
YANG YU HSIANG Master's Program, Institute of Geography, National Taiwan University
[Python]2022 Covid-19 database OXCGRT Exploration and Visualization, YANG YU HSIANG, 2022
I joined Geographical Information Science Lab in the Department of Geography in National Taiwan University. My academic supervisor is Professor Tzai-Hung Wen, Ph.D.
Any cooperation or suggestion is welcome to me. E-mail is on school system. Phonenumer and the Address is Geography Department of National Taiwan University
Since 7,August 2019 (Wed)