I joined Geographical Information Science Lab in the Department of Geography in National Taiwan University. My academic supervisor is Professor Tzai-Hung Wen, Ph.D.
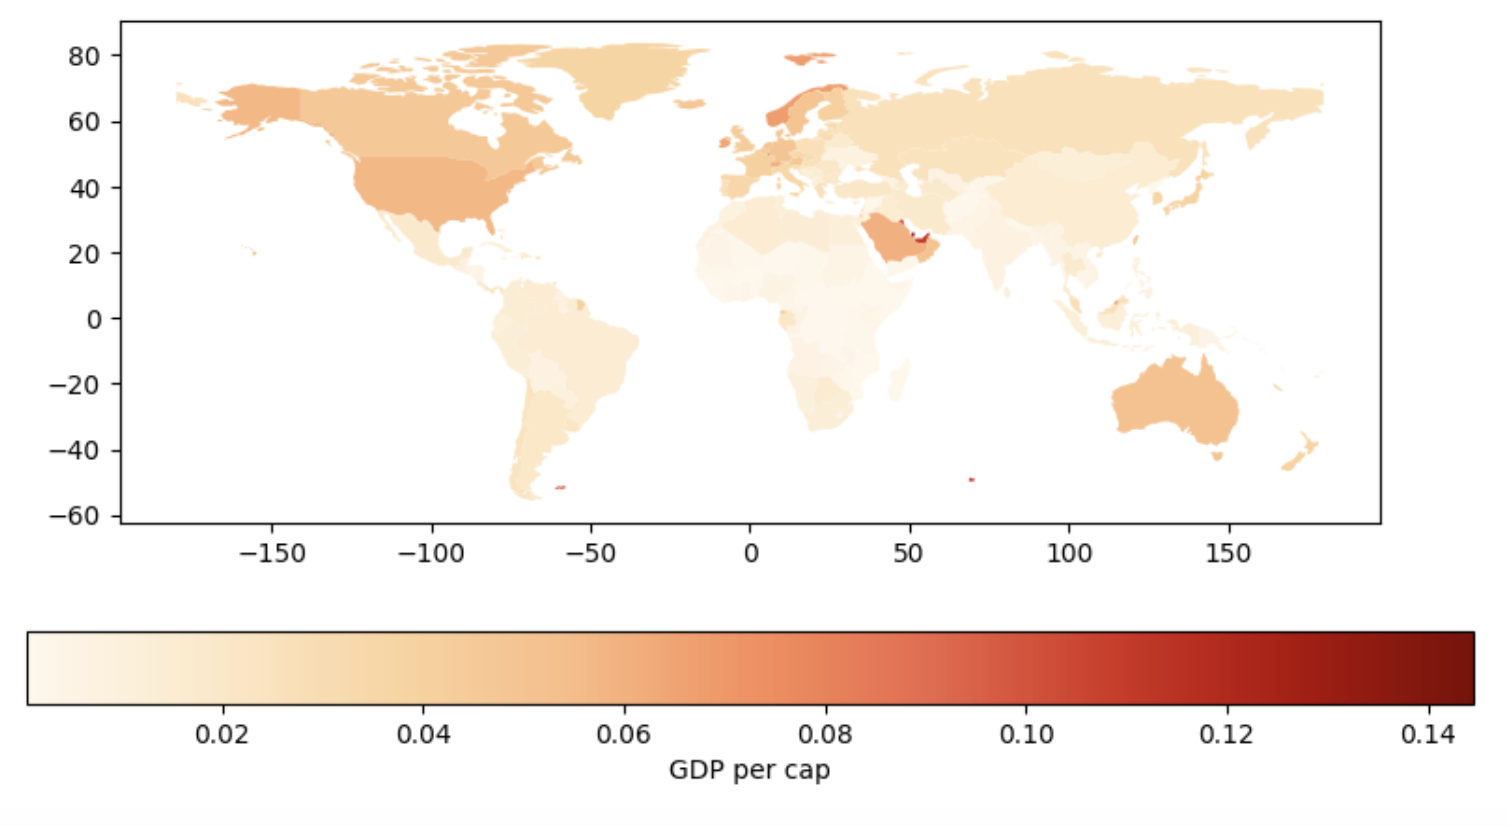
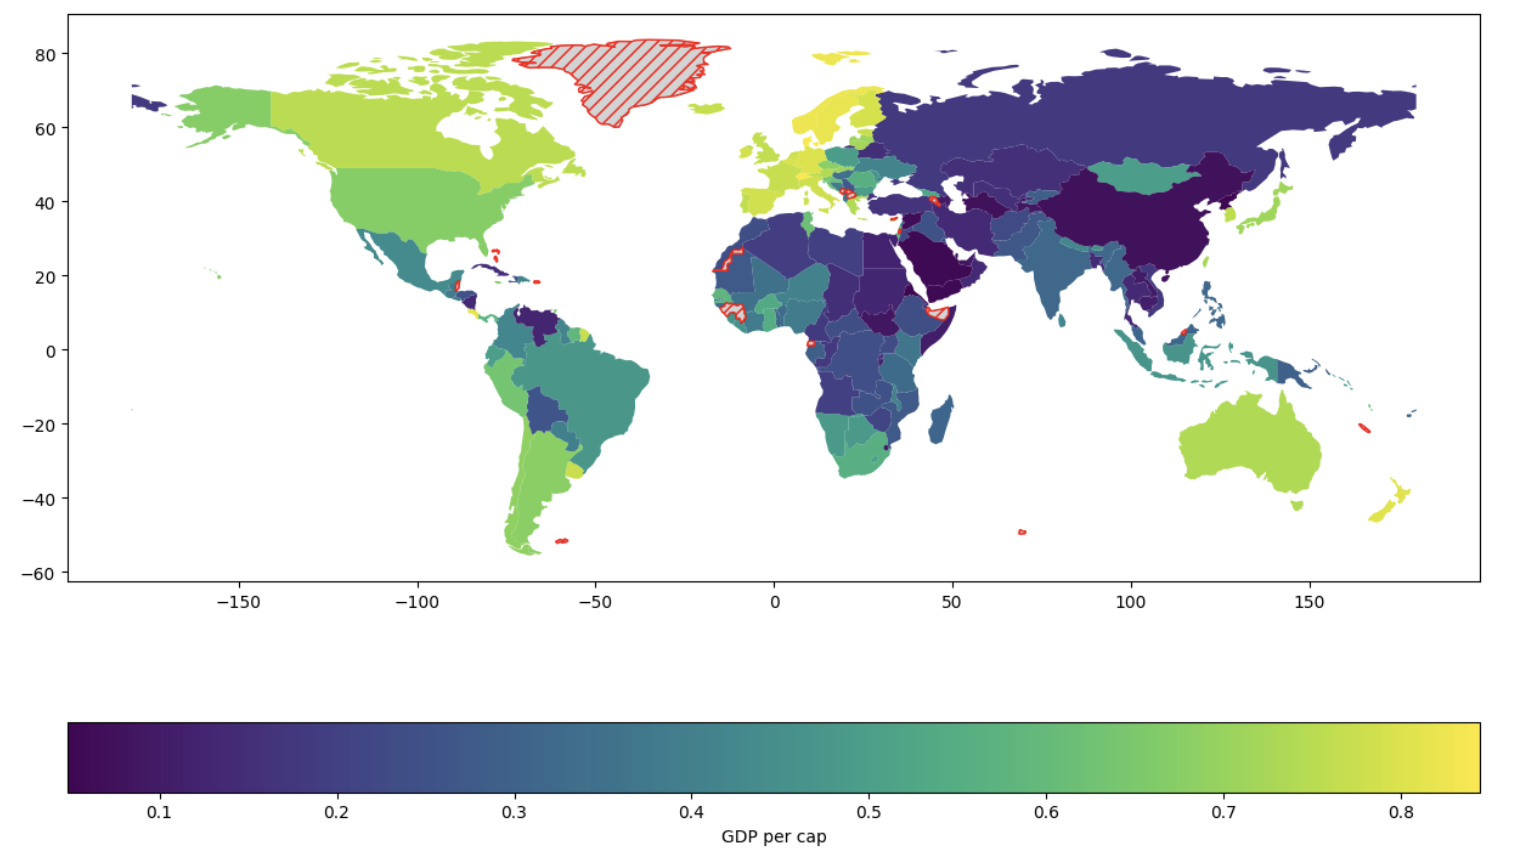
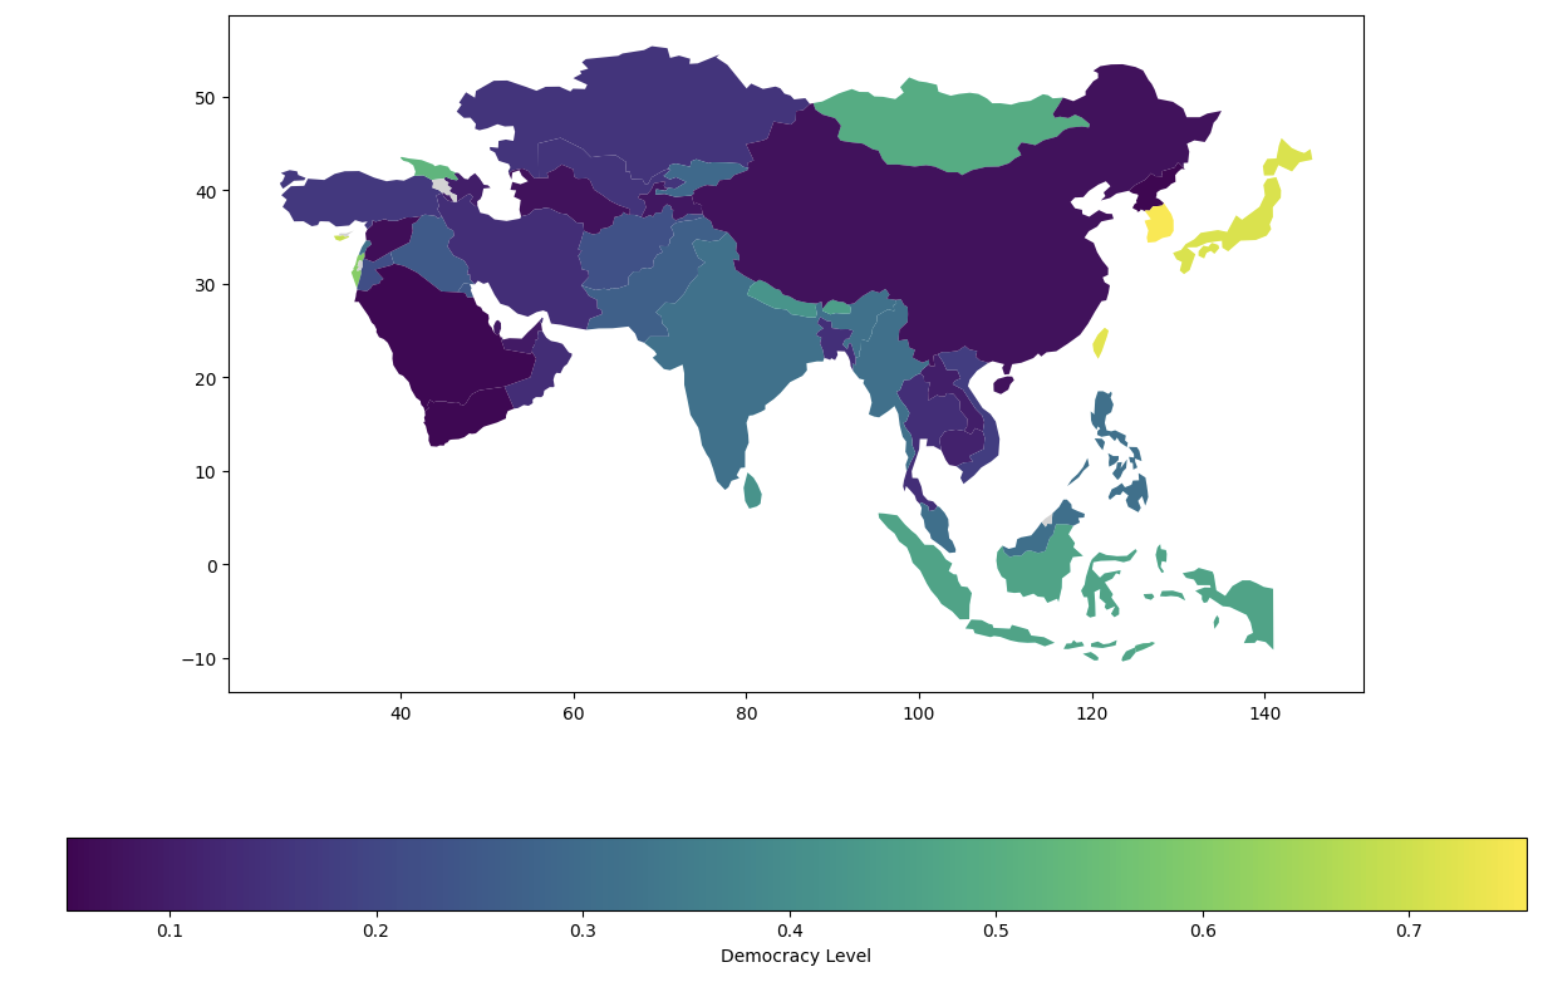
In this project, I utilized Pandas and GeoPandas to process and analyze global polygon layer data, presenting this information through visualized maps that depict the economic conditions and levels of democracy around the world. First, I used Pandas to read and organize economic and democracy data from multiple sources. Then, I combined this data with geographical spatial data using GeoPandas, creating detailed geospatial data frames. Next, I performed operations on the polygon layers to ensure data integrity and accuracy. After processing the data, I employed Matplotlib and other visualization tools to create a series of vivid maps showcasing the economic conditions and democracy levels of various countries. These maps use elements like color, size, and shape to facilitate easy comparison and analysis of differences between countries. This project not only provides a powerful demonstration of data analysis but also uses visualization tools to make complex global economic and political data easy to understand.
在這個專案中,我利用 Pandas 和 GeoPandas 來處理和分析全球多邊形圖層資料,並將這些資料以視覺化地圖呈現,展示世界各國的經濟狀況與民主程度。 首先,我使用 Pandas 讀取和整理來自多個來源的經濟與民主數據,然後利用 GeoPandas 將這些數據與地理空間數據結合,創建出詳細的地理數據框架。接著,通過多邊形圖層操作,確保數據的完整性和準確性。 完成數據處理後,我使用 Matplotlib 和其他可視化工具,創建了一系列生動的地圖,展示各國的經濟狀況和民主程度。這些地圖通過顏色、大小和形狀等元素,使使用者能夠輕鬆比較和分析各國之間的差異。
[Python] 2022 Mapping the socioeconomic index around the world, YANG YU HSIANG, 2022
I joined Geographical Information Science Lab in the Department of Geography in National Taiwan University. My academic supervisor is Professor Tzai-Hung Wen, Ph.D.
Any cooperation or suggestion is welcome to me. E-mail is on school system. Phonenumer and the Address is Geography Department of National Taiwan University
Since 7,August 2019 (Wed)