
I joined Geographical Information Science Lab in the Department of Geography in National Taiwan University. My academic supervisor is Professor Tzai-Hung Wen, Ph.D.
https://www.data.jma.go.jp/yoho/typhoon/position_table/table2021.html
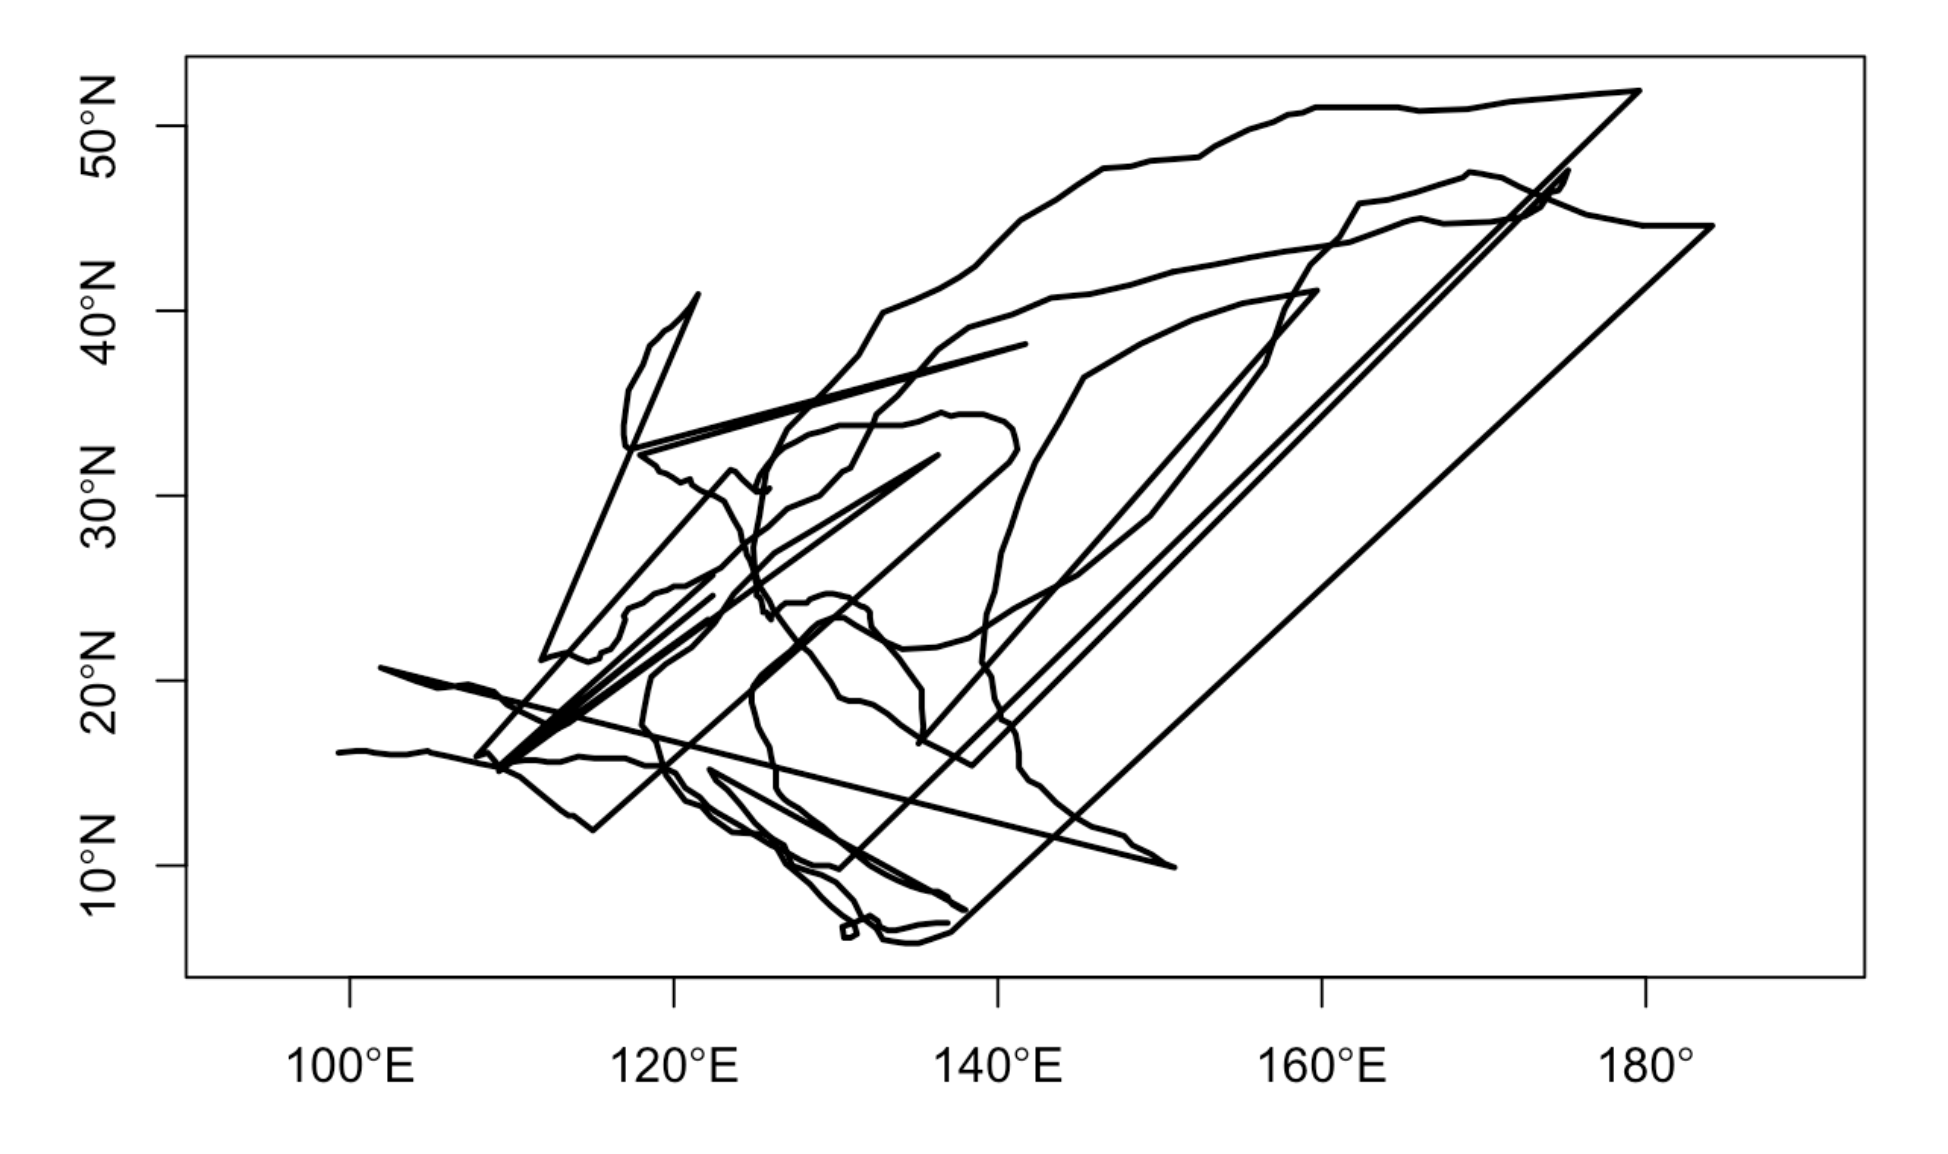
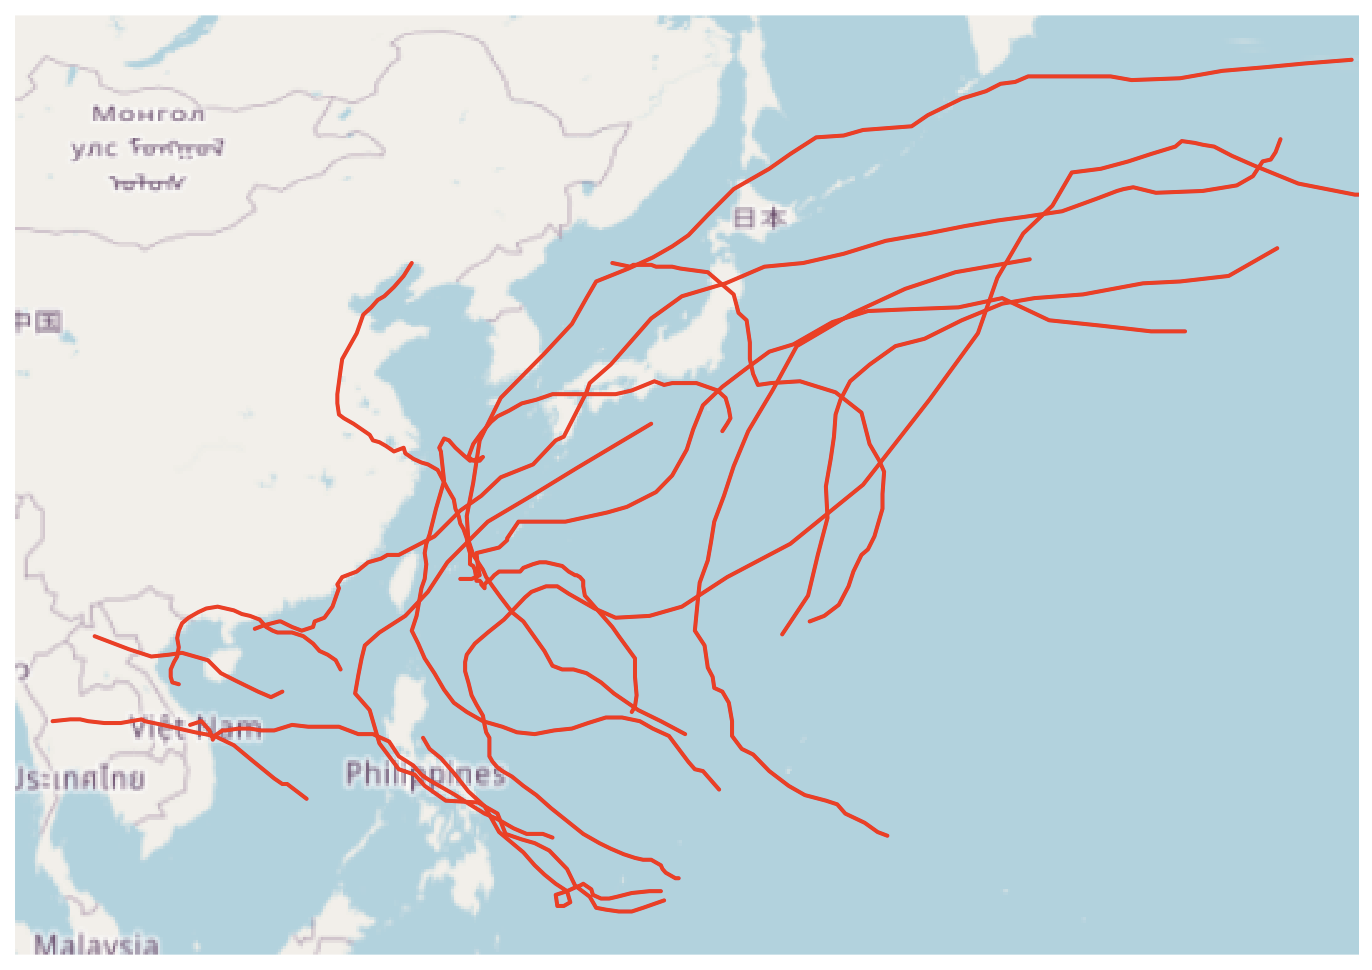
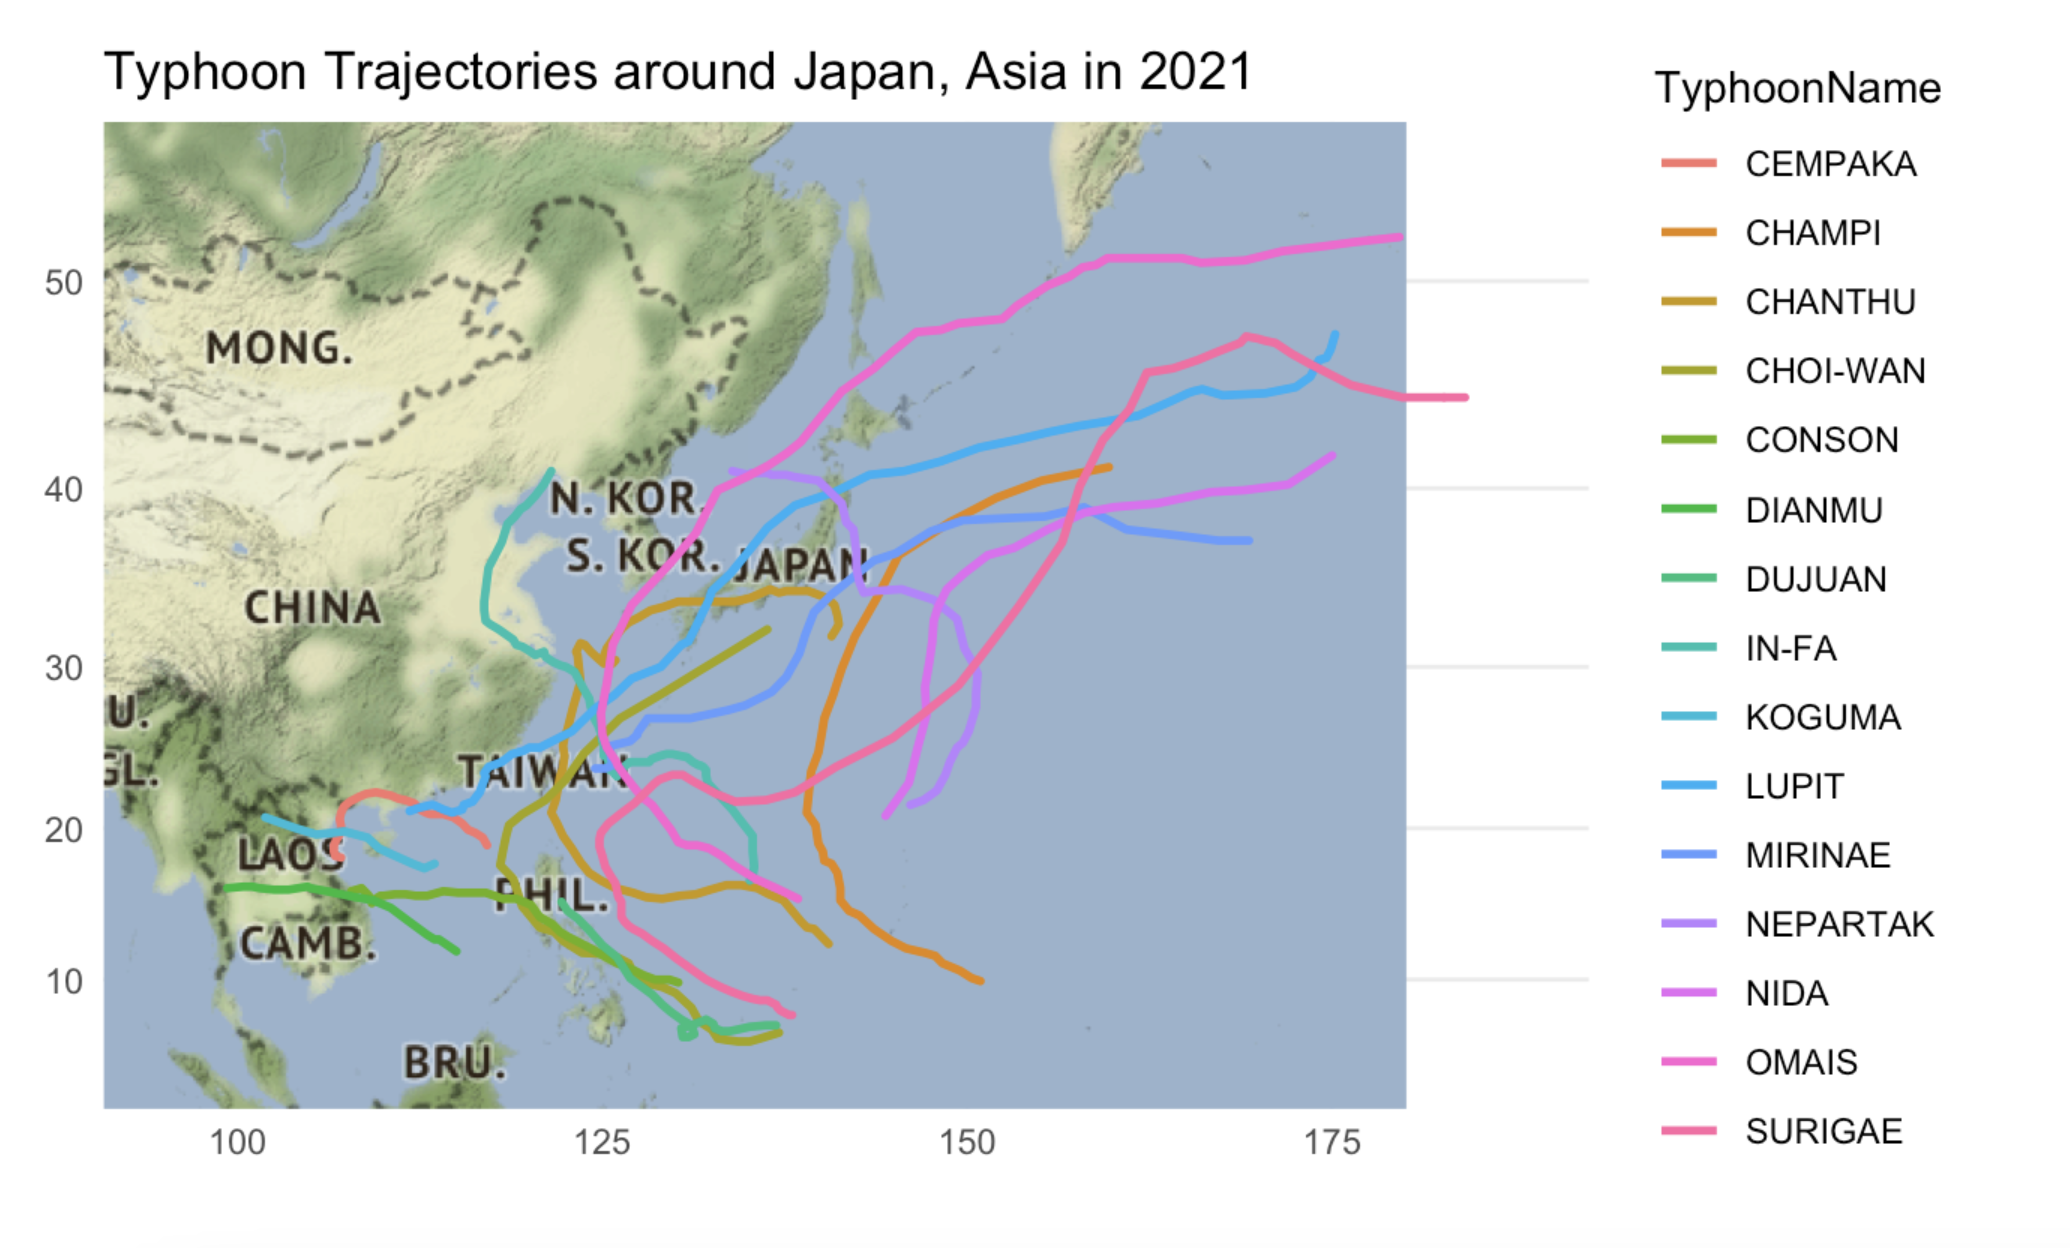
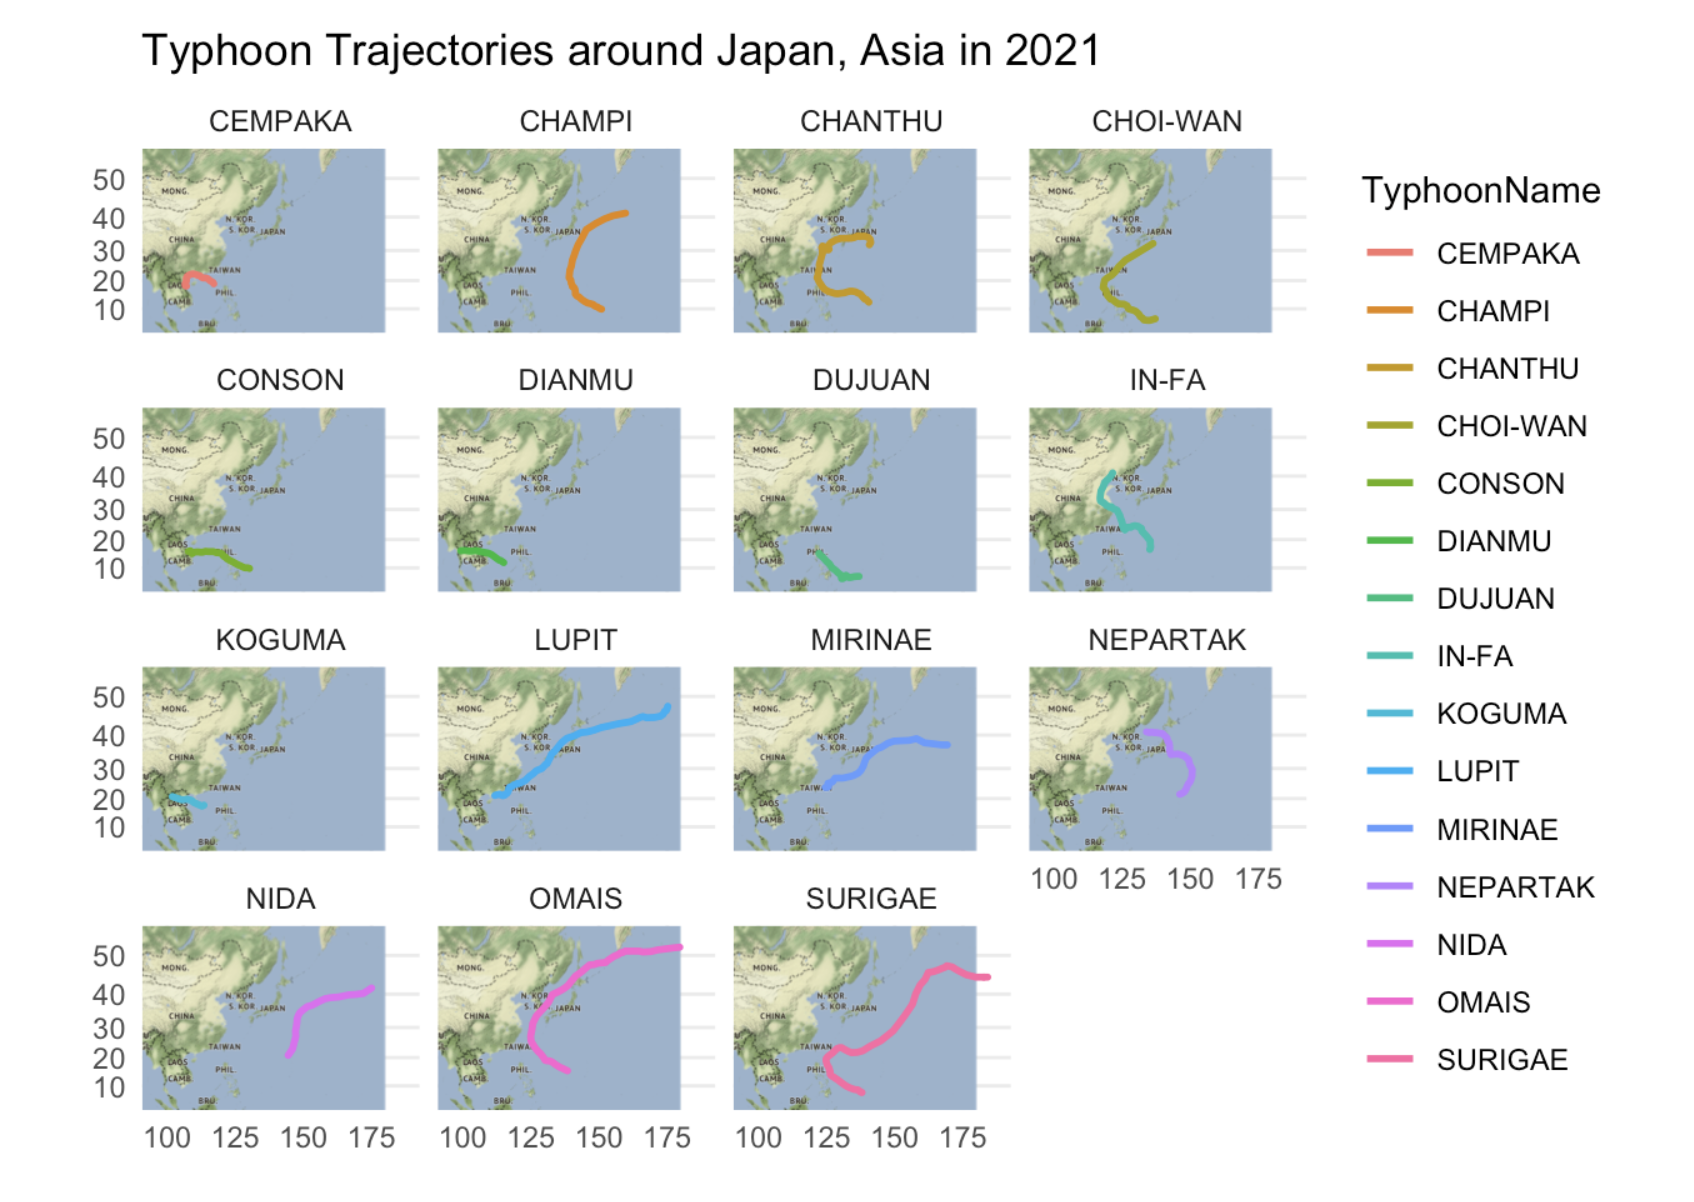
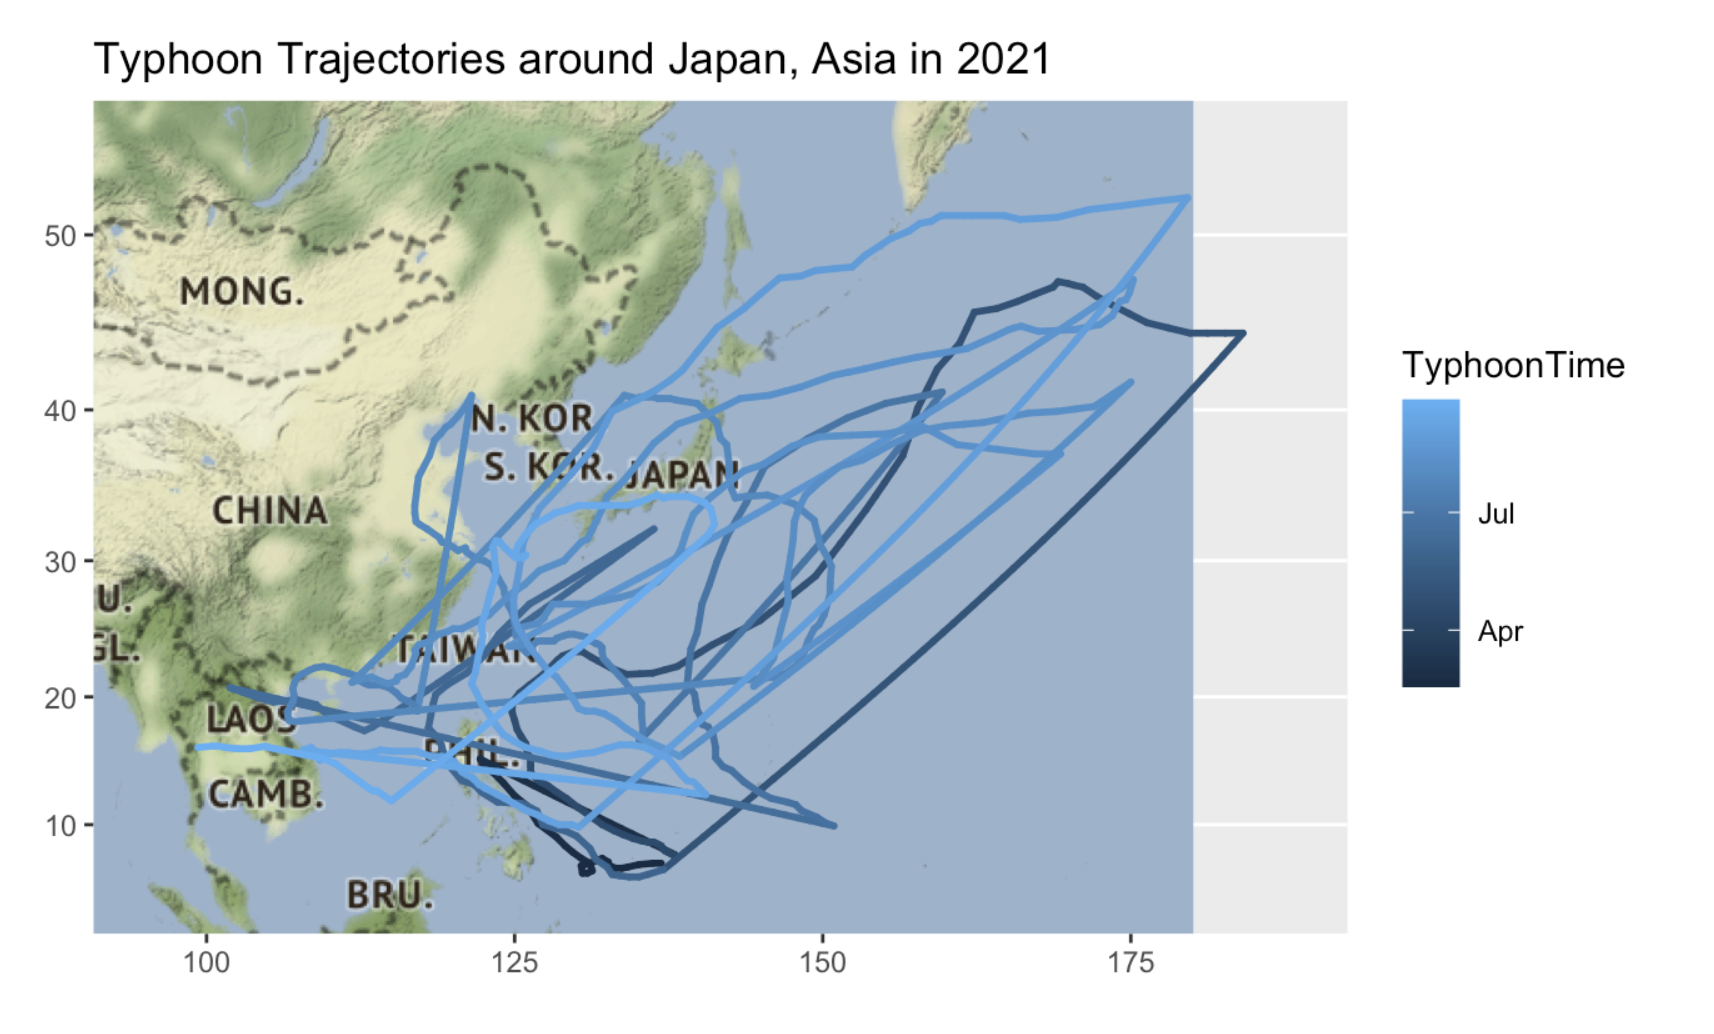
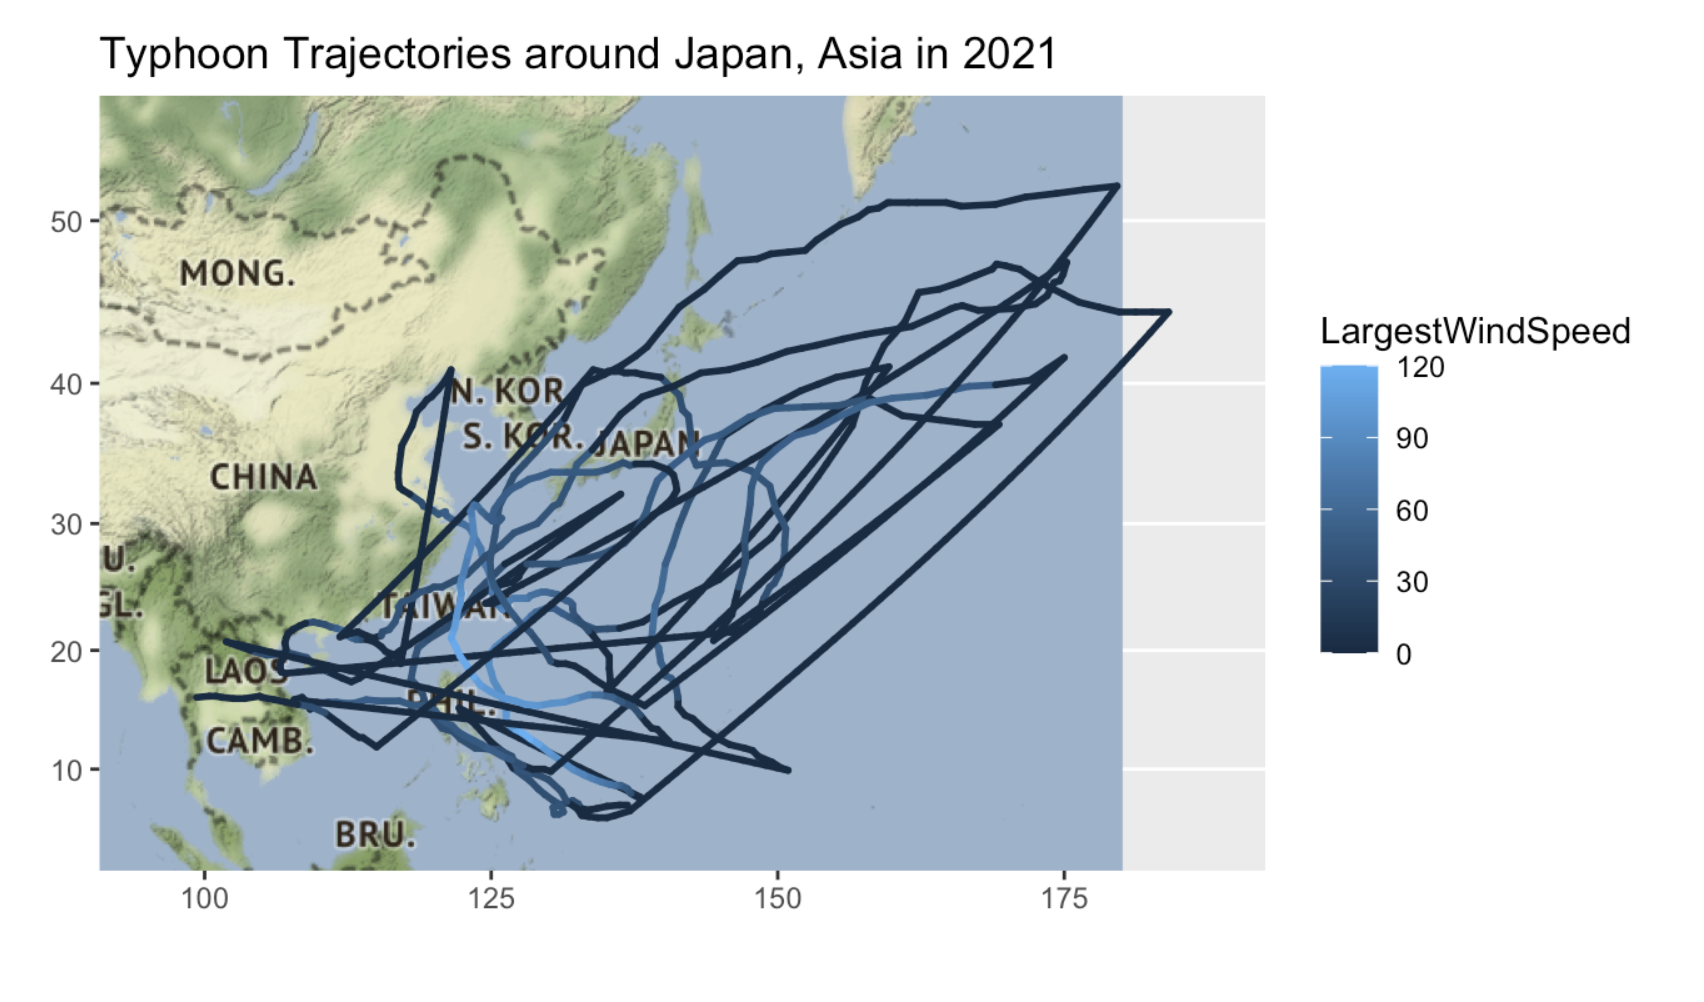
The typhoon trajectories data is from the open data plaform of Japan governement. There are 15 typhoons occuring from Feb, 2021 to Sep, 2021 recorded in the data. It start with the name Chempaka and end with Surigae. As showed in the plot, the typhoon occurs near Pacific Ocean in the west of Japan. Each typhoon has different tracks. Some of them turn northward and others turn southward. What I found that is interesting is that in Early summer around July, typhoon appears in Pacific ocean but in the late summer, typhoon appears more east to the land sides. The darker the line is, the earlier the typhoons appear.
2021-1 Trajectory, Raster and Vector Data Analysis Project 1: Trajectory Analysis of Typhoon path in Japan

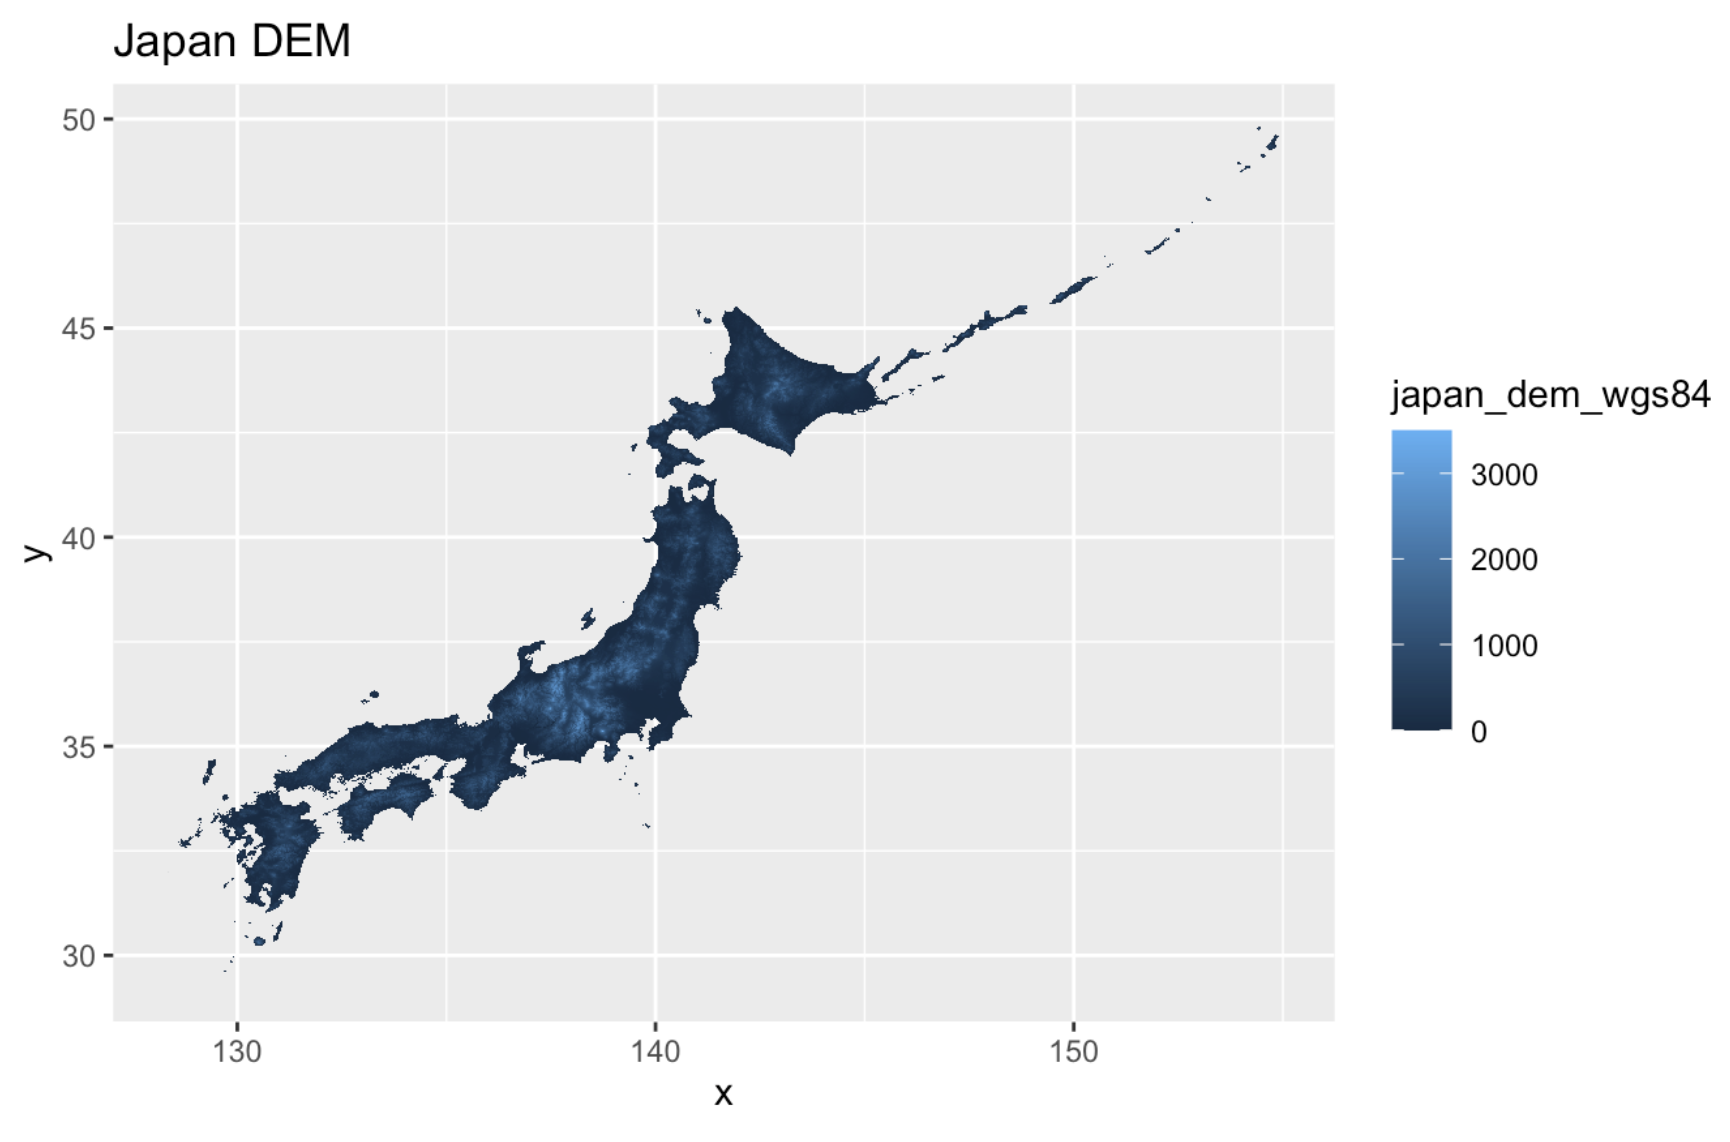
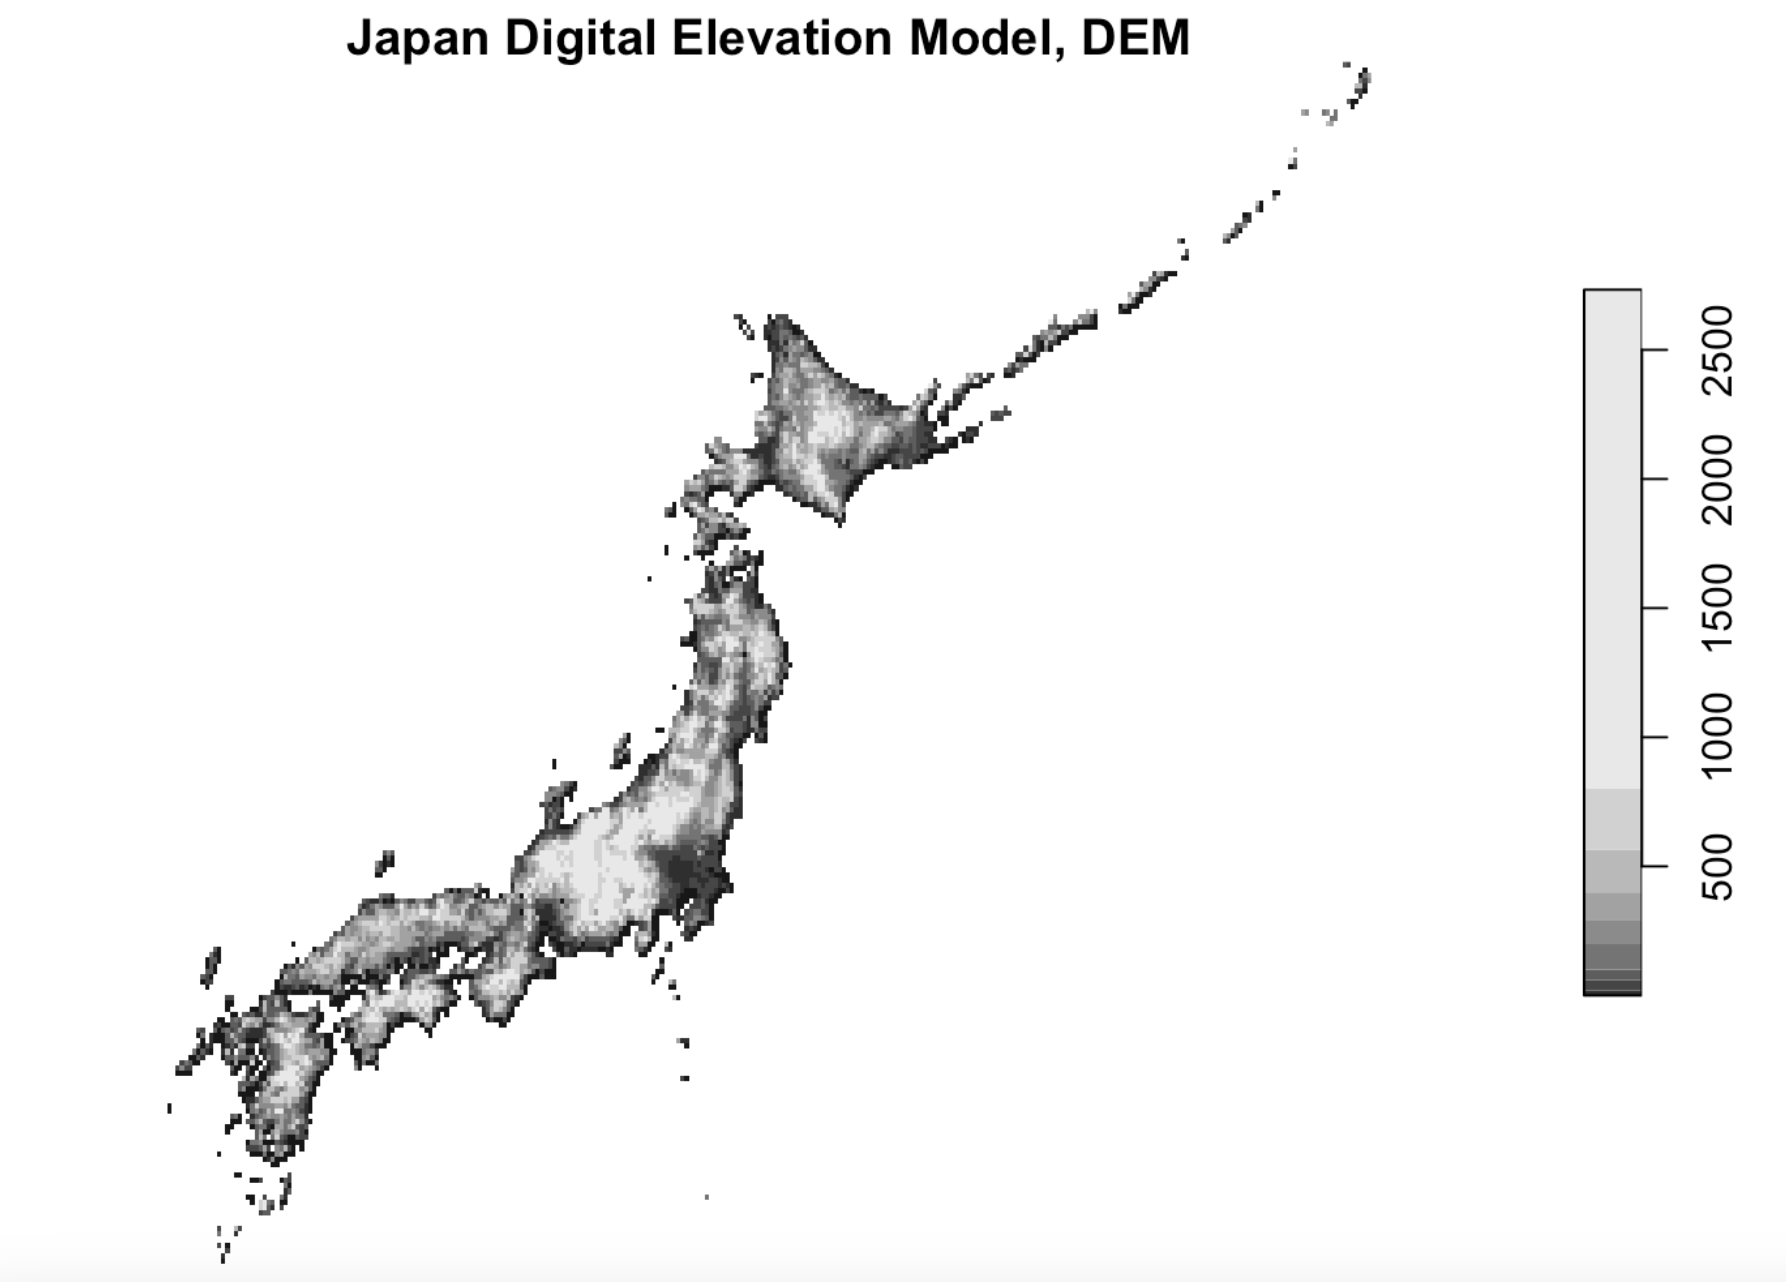
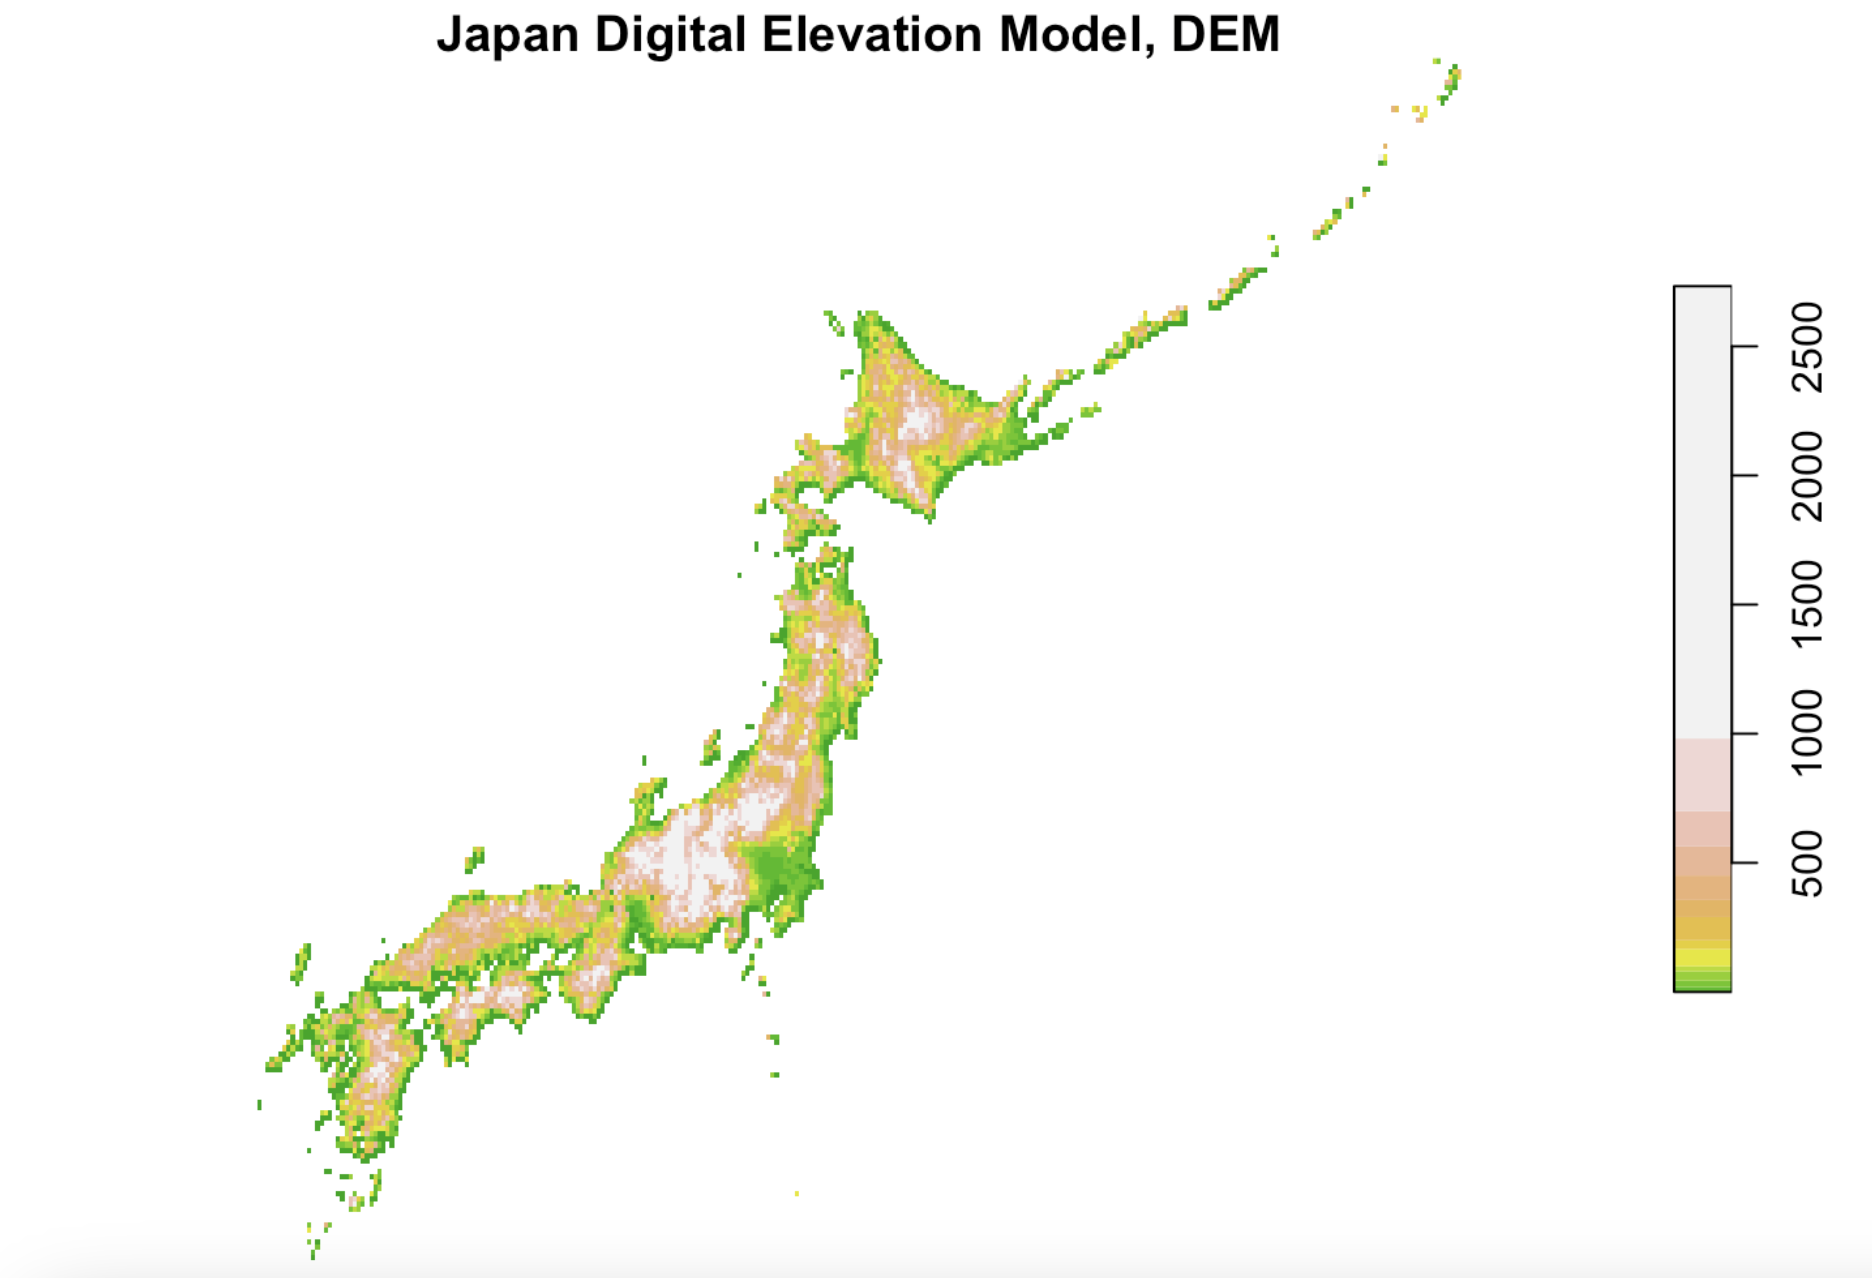
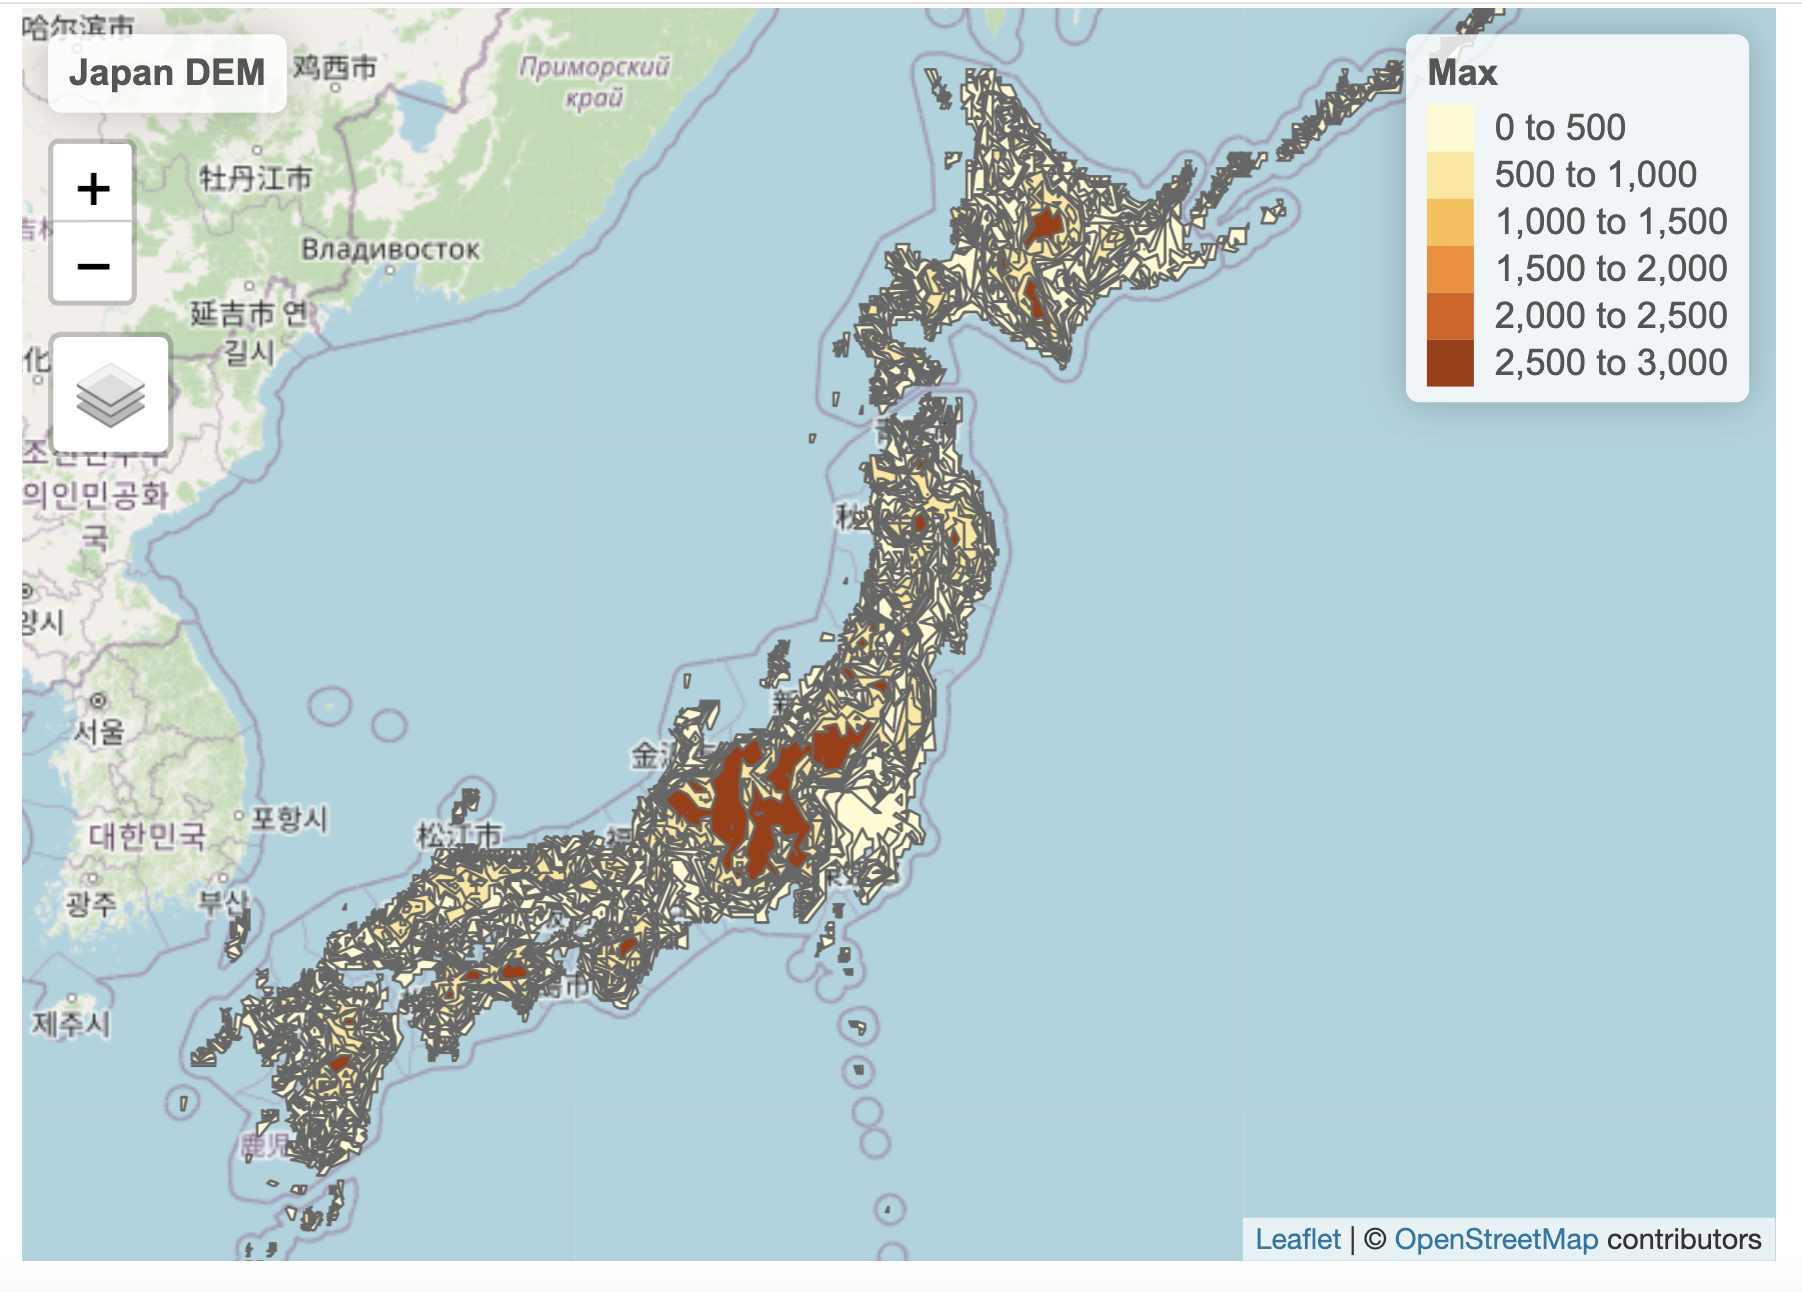
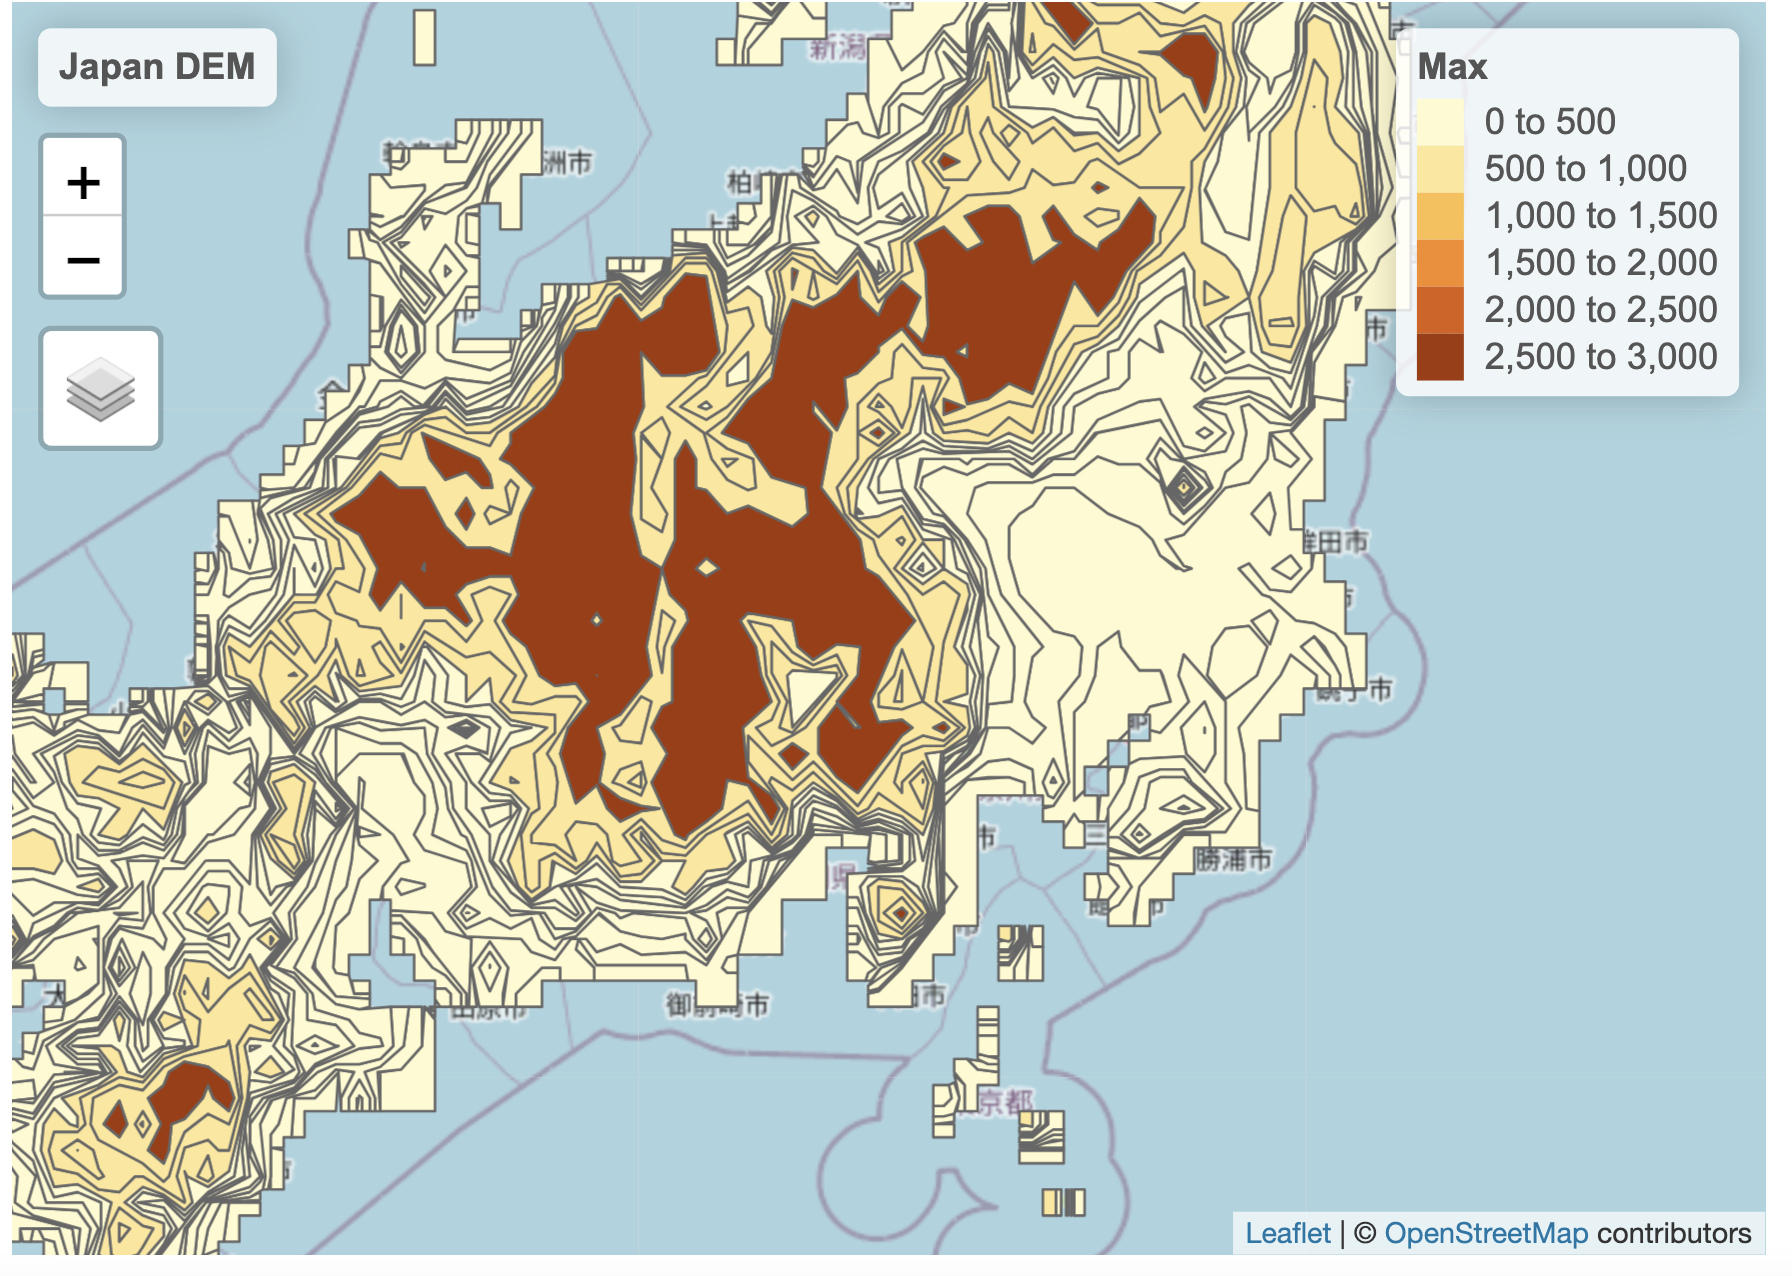
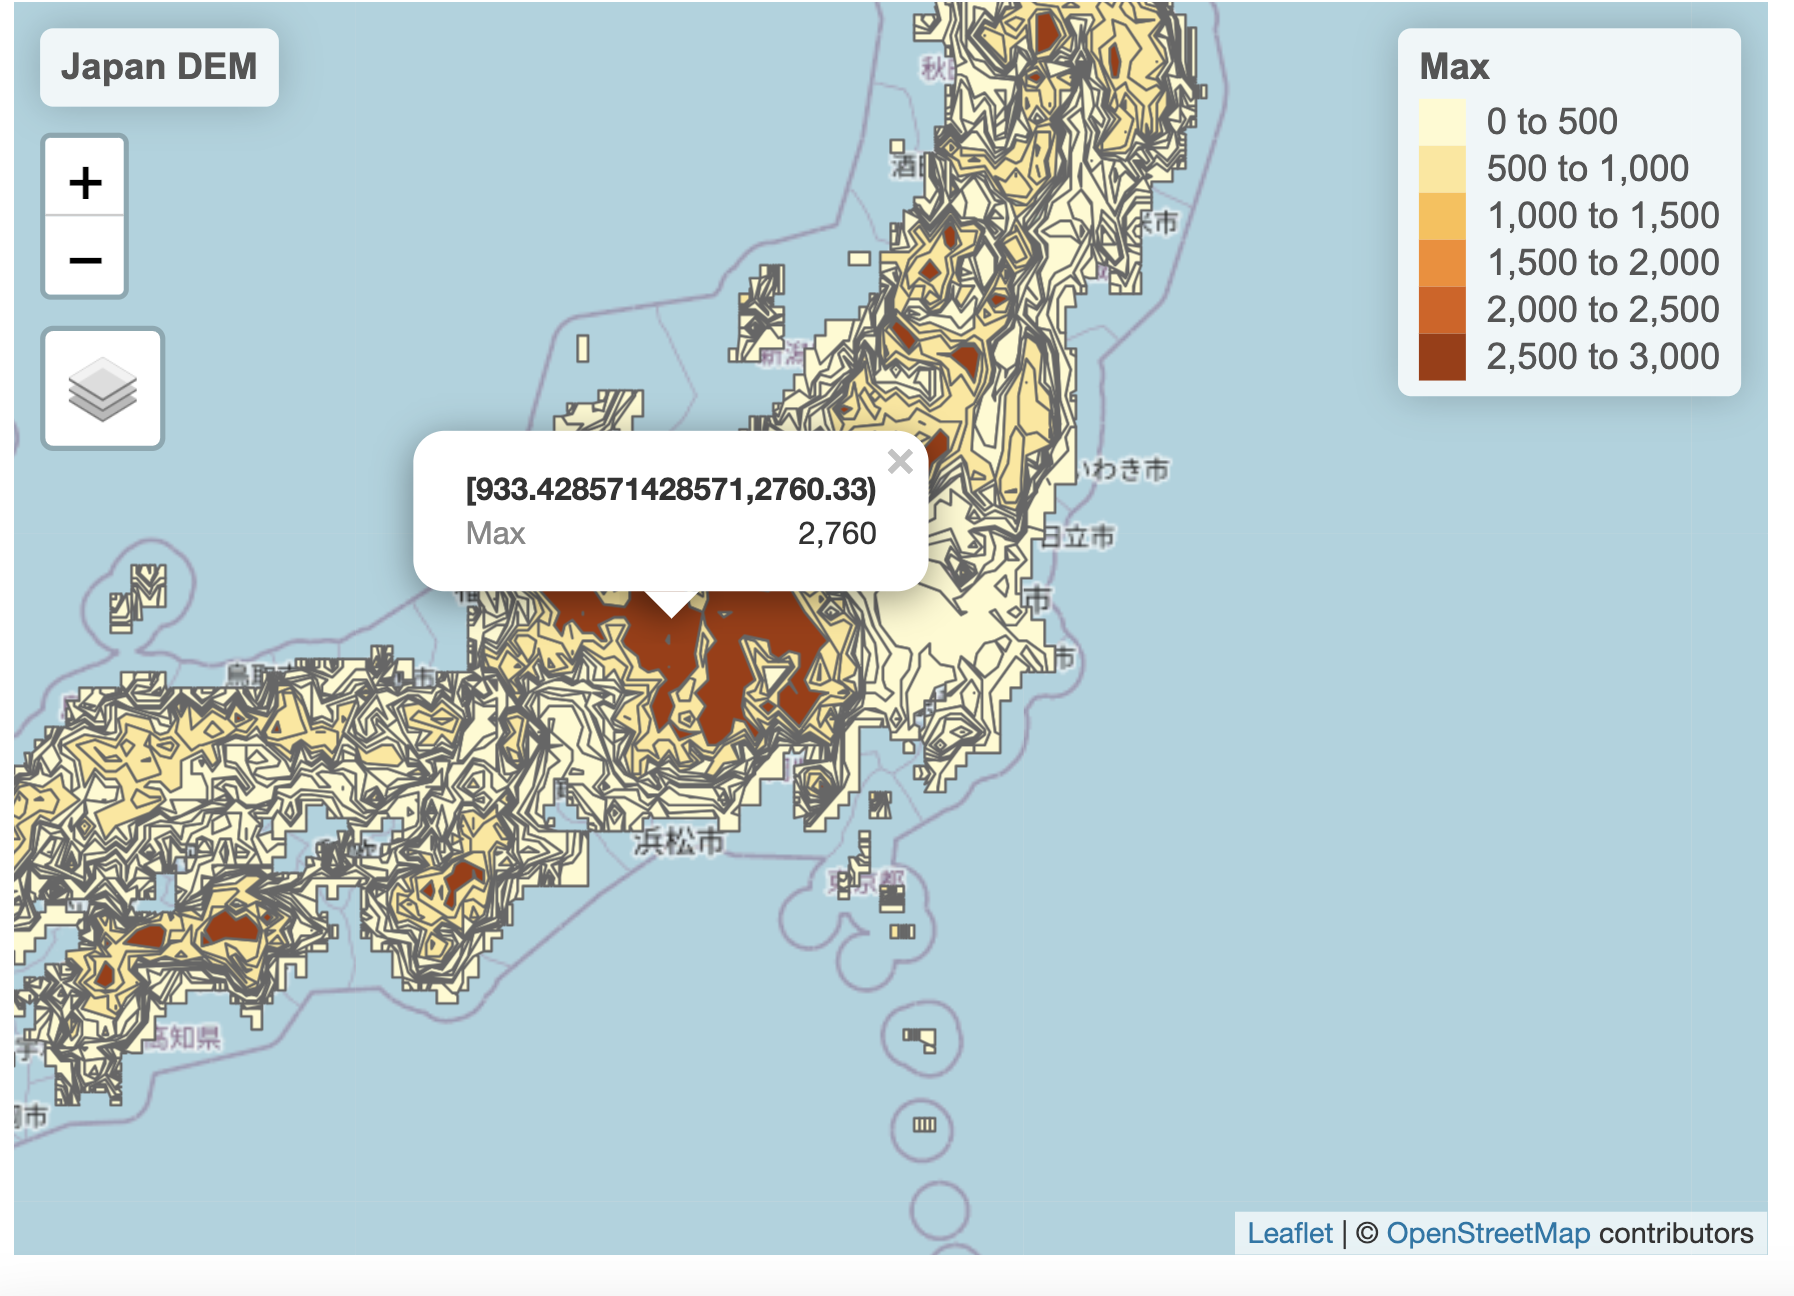
Overall, Japan is very mountainous, the moustain area is much more than the plain areas. The elevation in Japan is especially high in Honsyu island, which is the largest island among other island including kyushyu, shikoku and hokkaido. The most distinguishable plain with low sea level is Kantou plain, where the Tokyo, Saitama, Chiba, Kanagawa ken, which are also known as Captial Circlie of Japan are situated. This is very reasonable that people tends to build sity in the low sea level area instead of mountainous area.
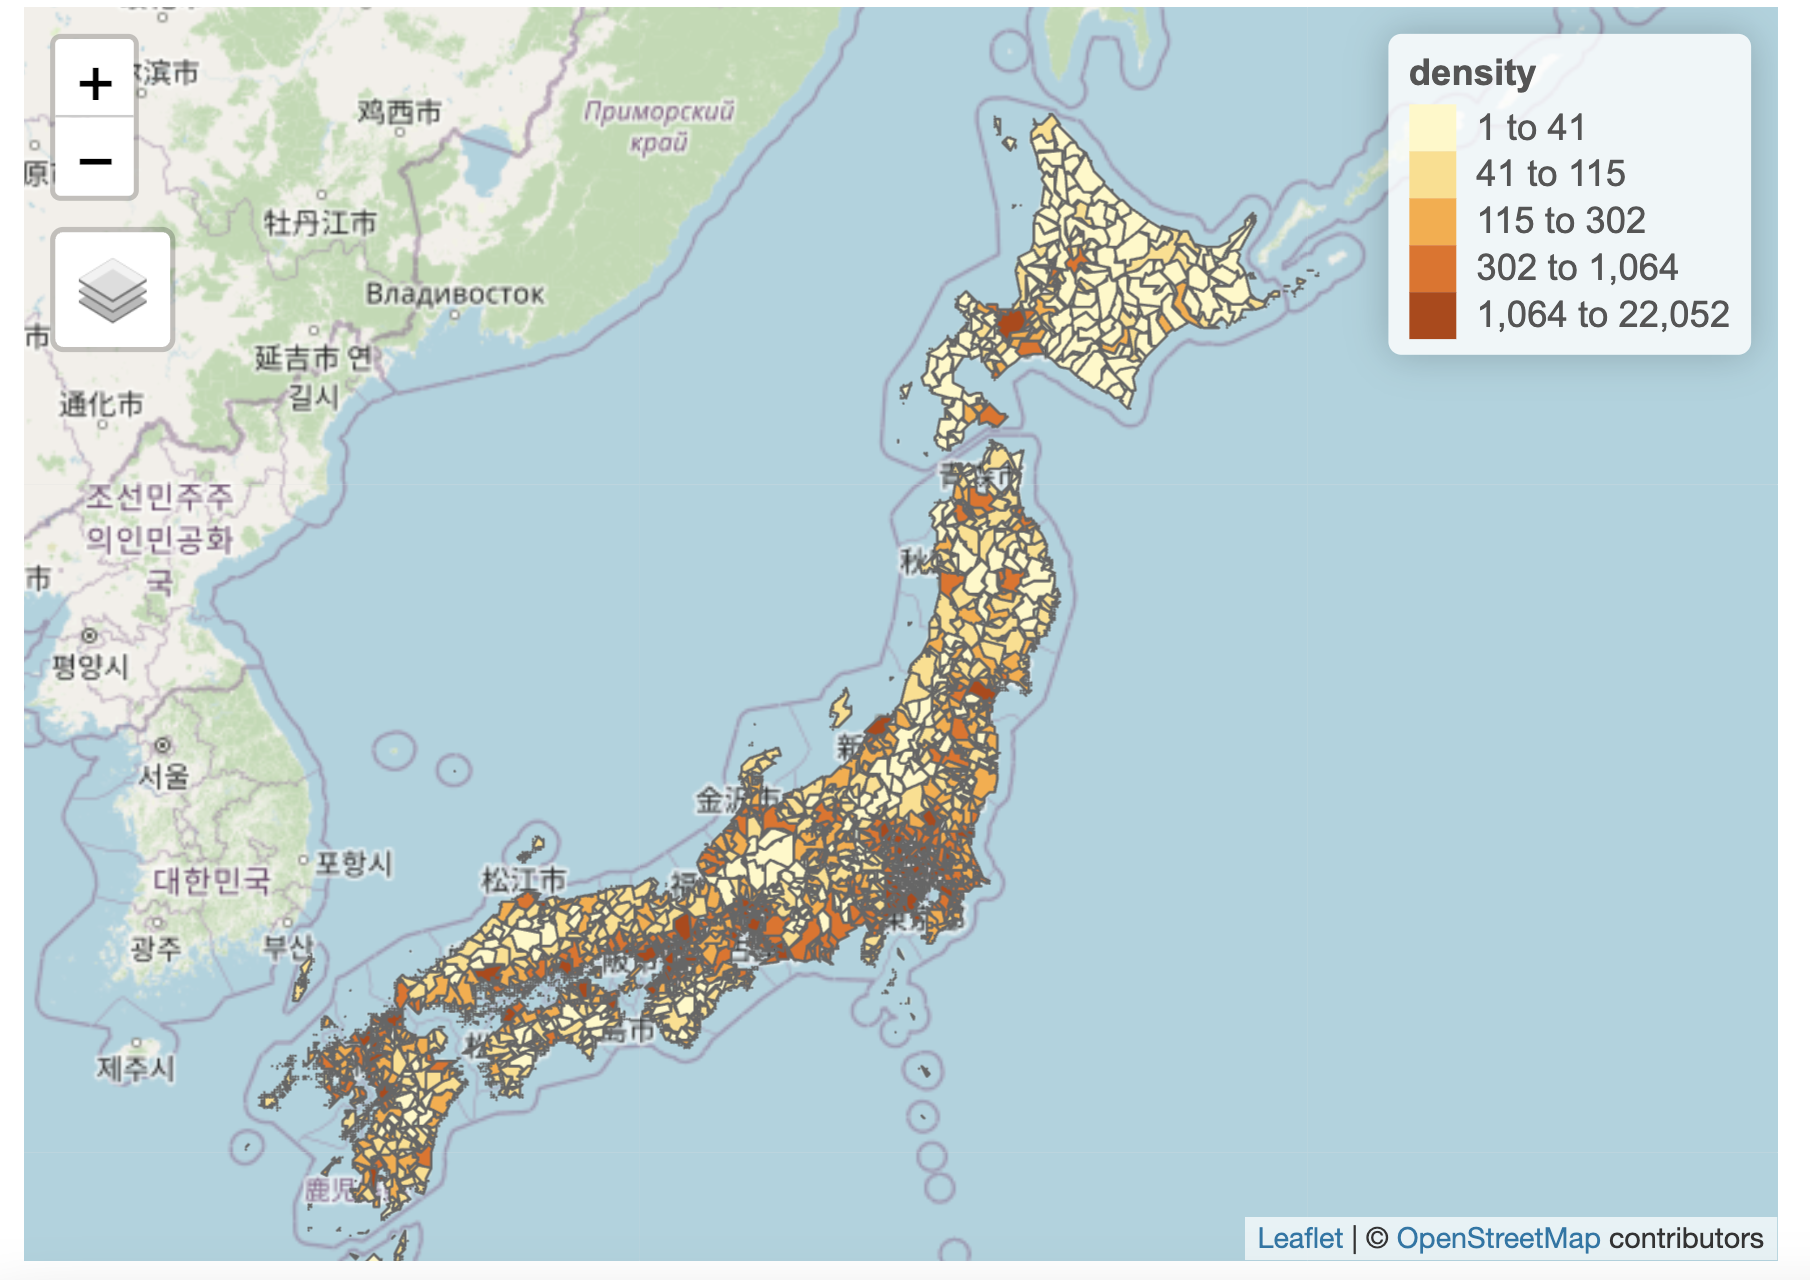
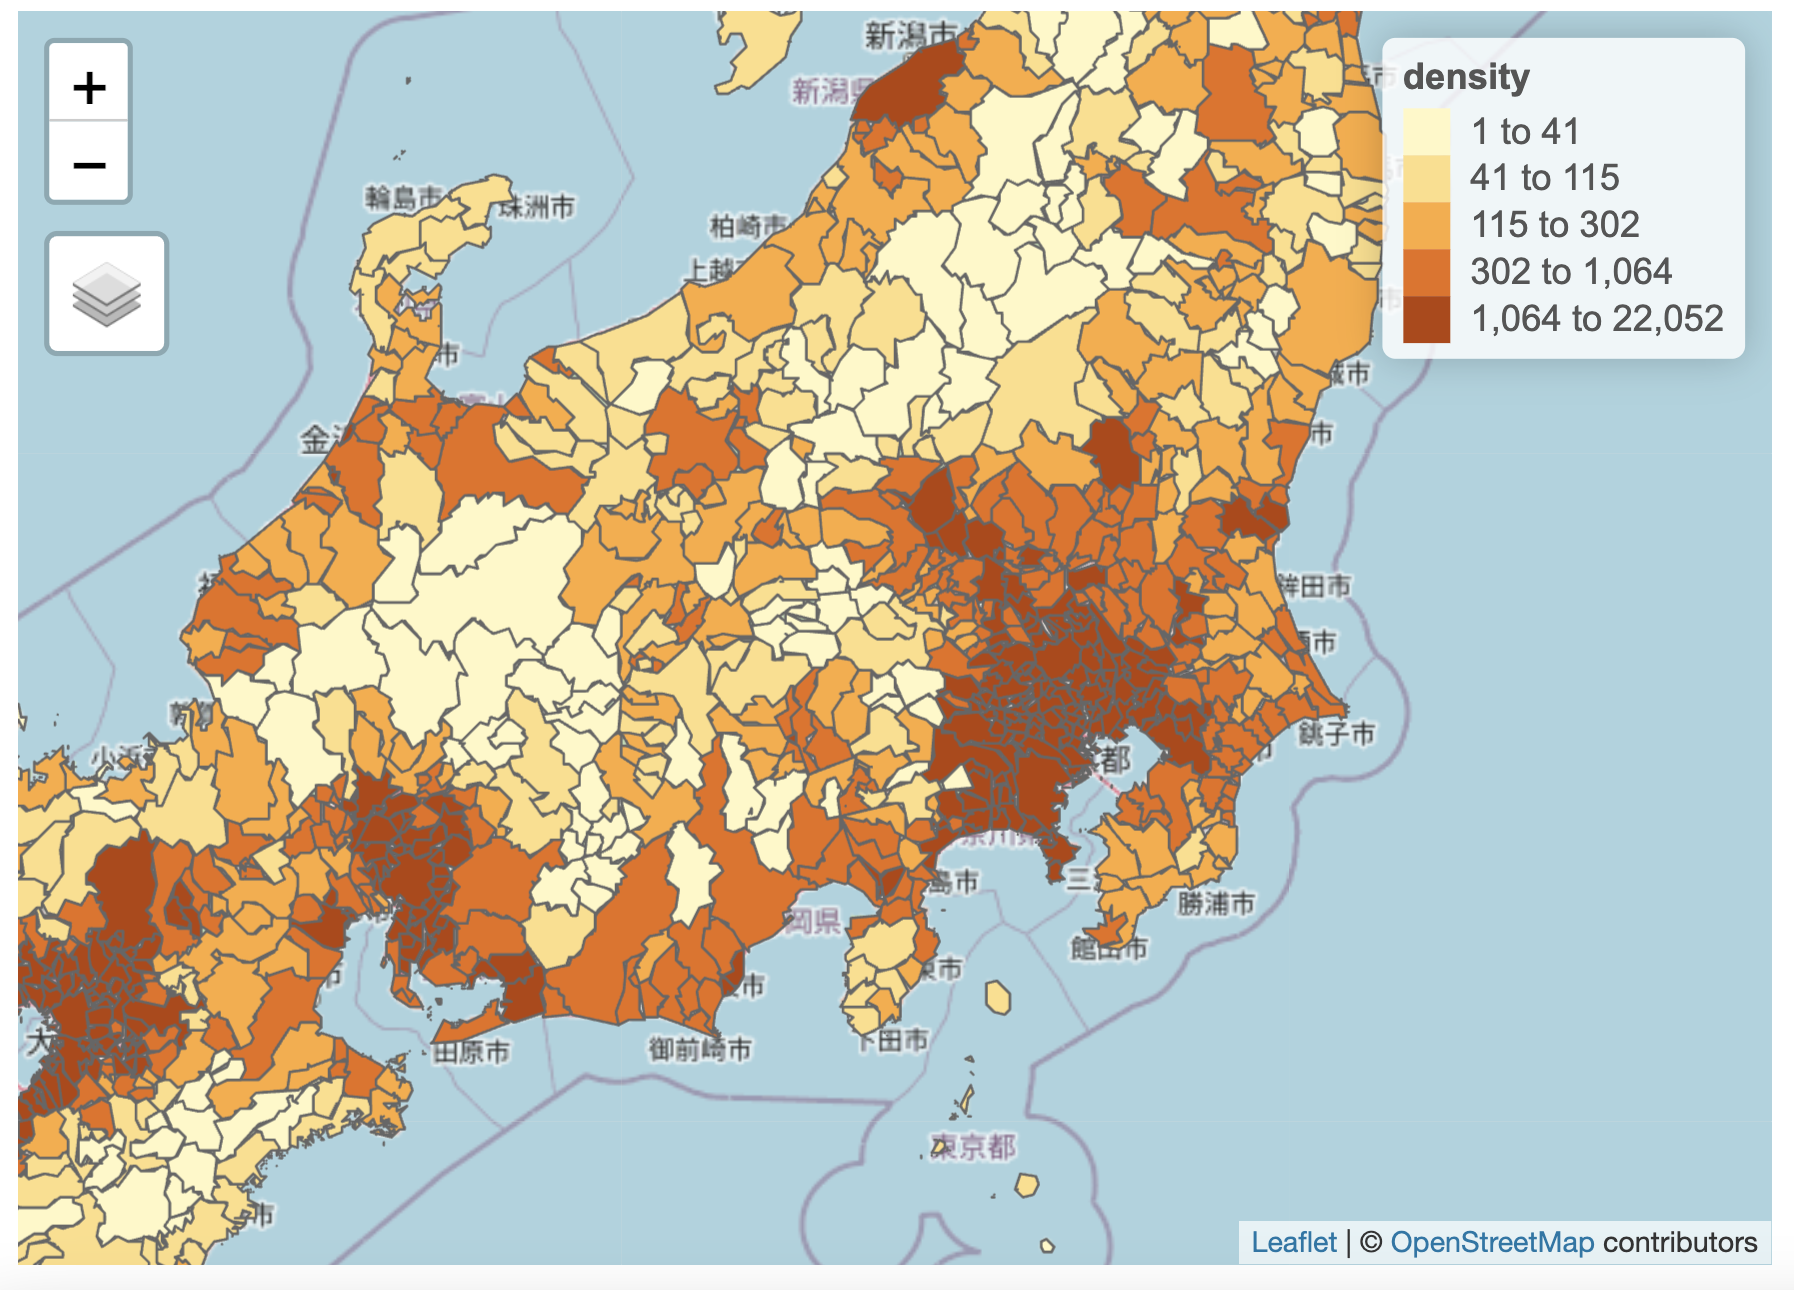
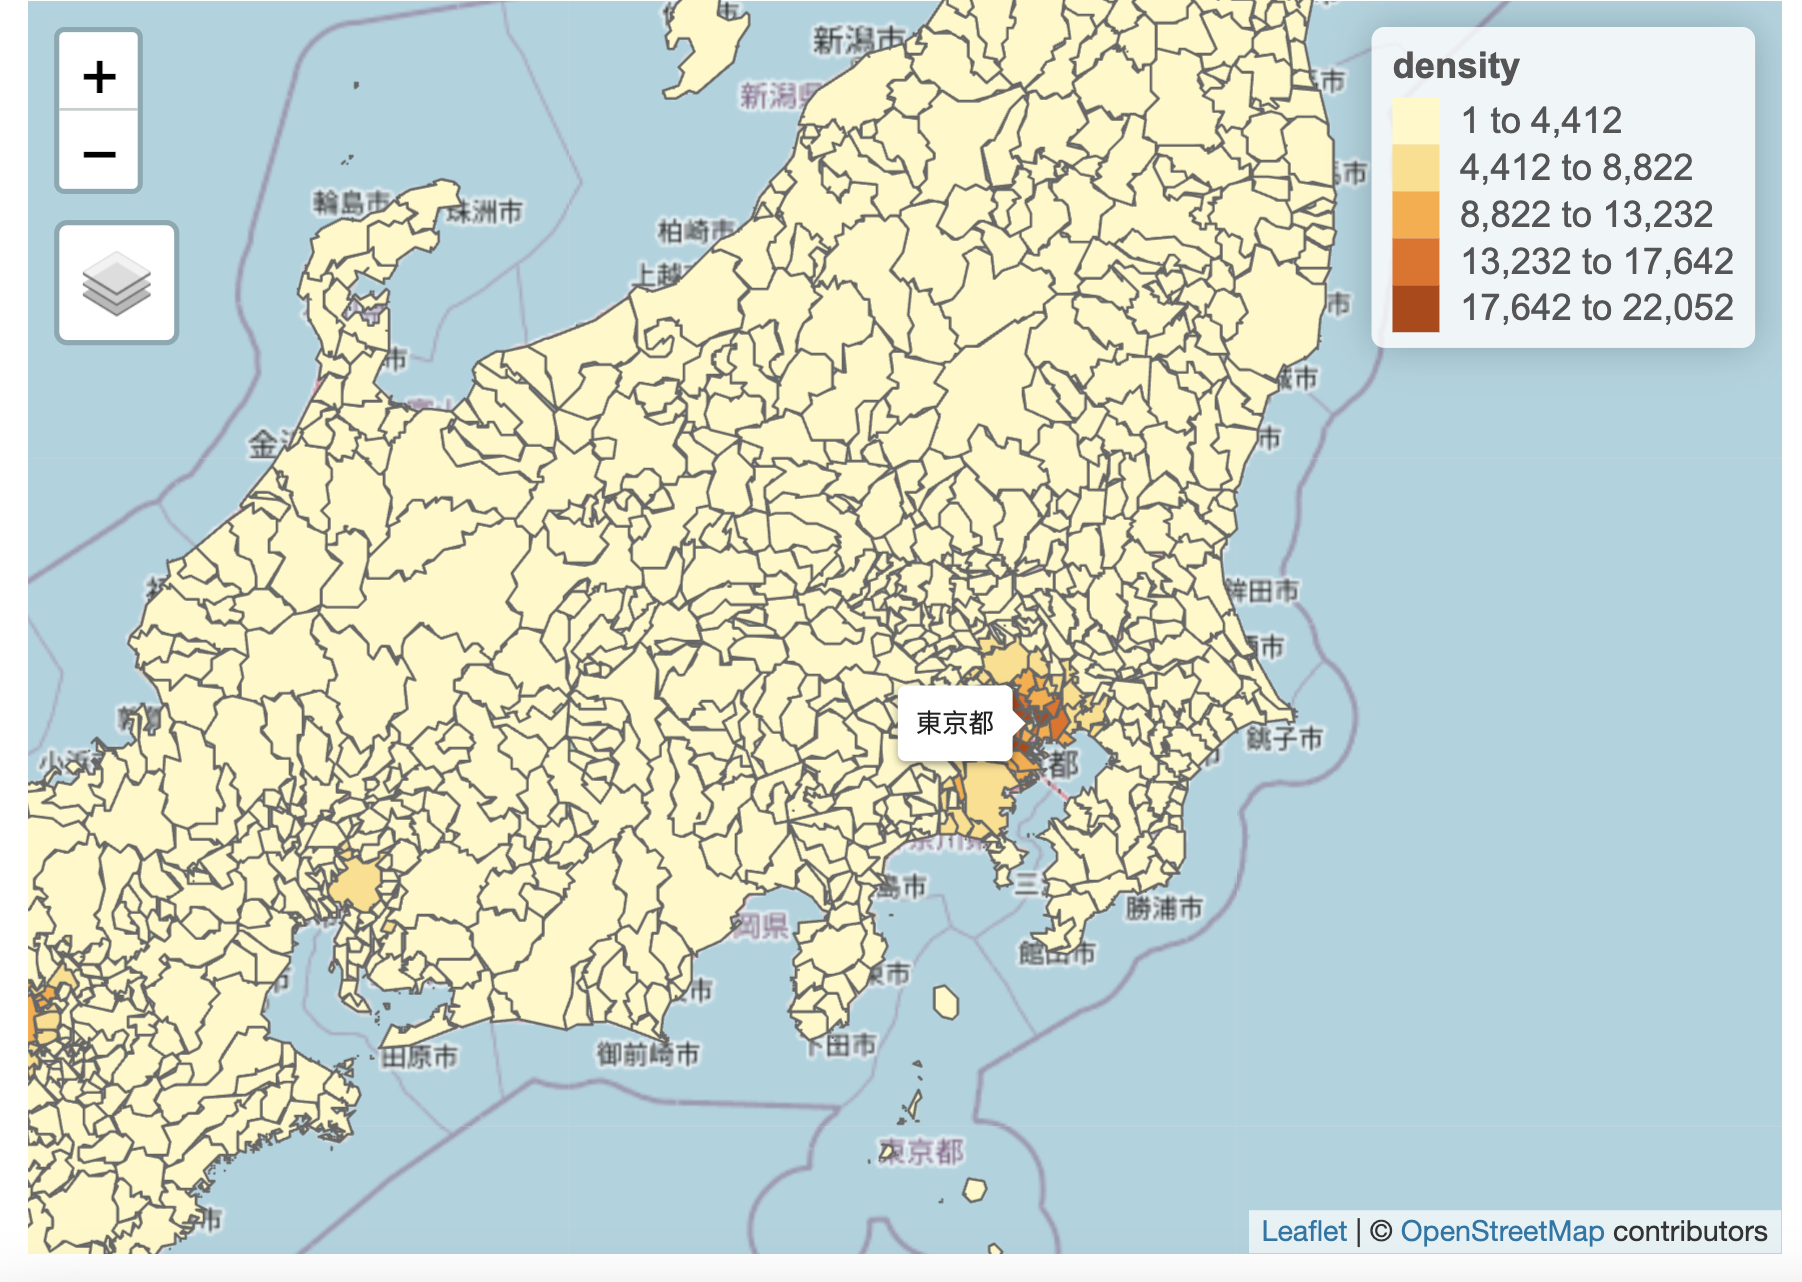
In order to verify the concept, I also make a population denstiy map to compare with the DEM map, as we can see, the population is more dense in the plain area than the mountain area, which makes sense to us in Taiwan, where is also mountainous.
2021-1 Trajectory, Raster and Vector Project 2: Topography from DEM and Population Density Map in Japan
I joined Geographical Information Science Lab in the Department of Geography in National Taiwan University. My academic supervisor is Professor Tzai-Hung Wen, Ph.D.
Any cooperation or suggestion is welcome to me. E-mail is on school system. Phonenumer and the Address is Geography Department of National Taiwan University
Since 7,August 2019 (Wed)