
I joined Geographical Information Science Lab in the Department of Geography in National Taiwan University. My academic supervisor is Professor Tzai-Hung Wen, Ph.D.
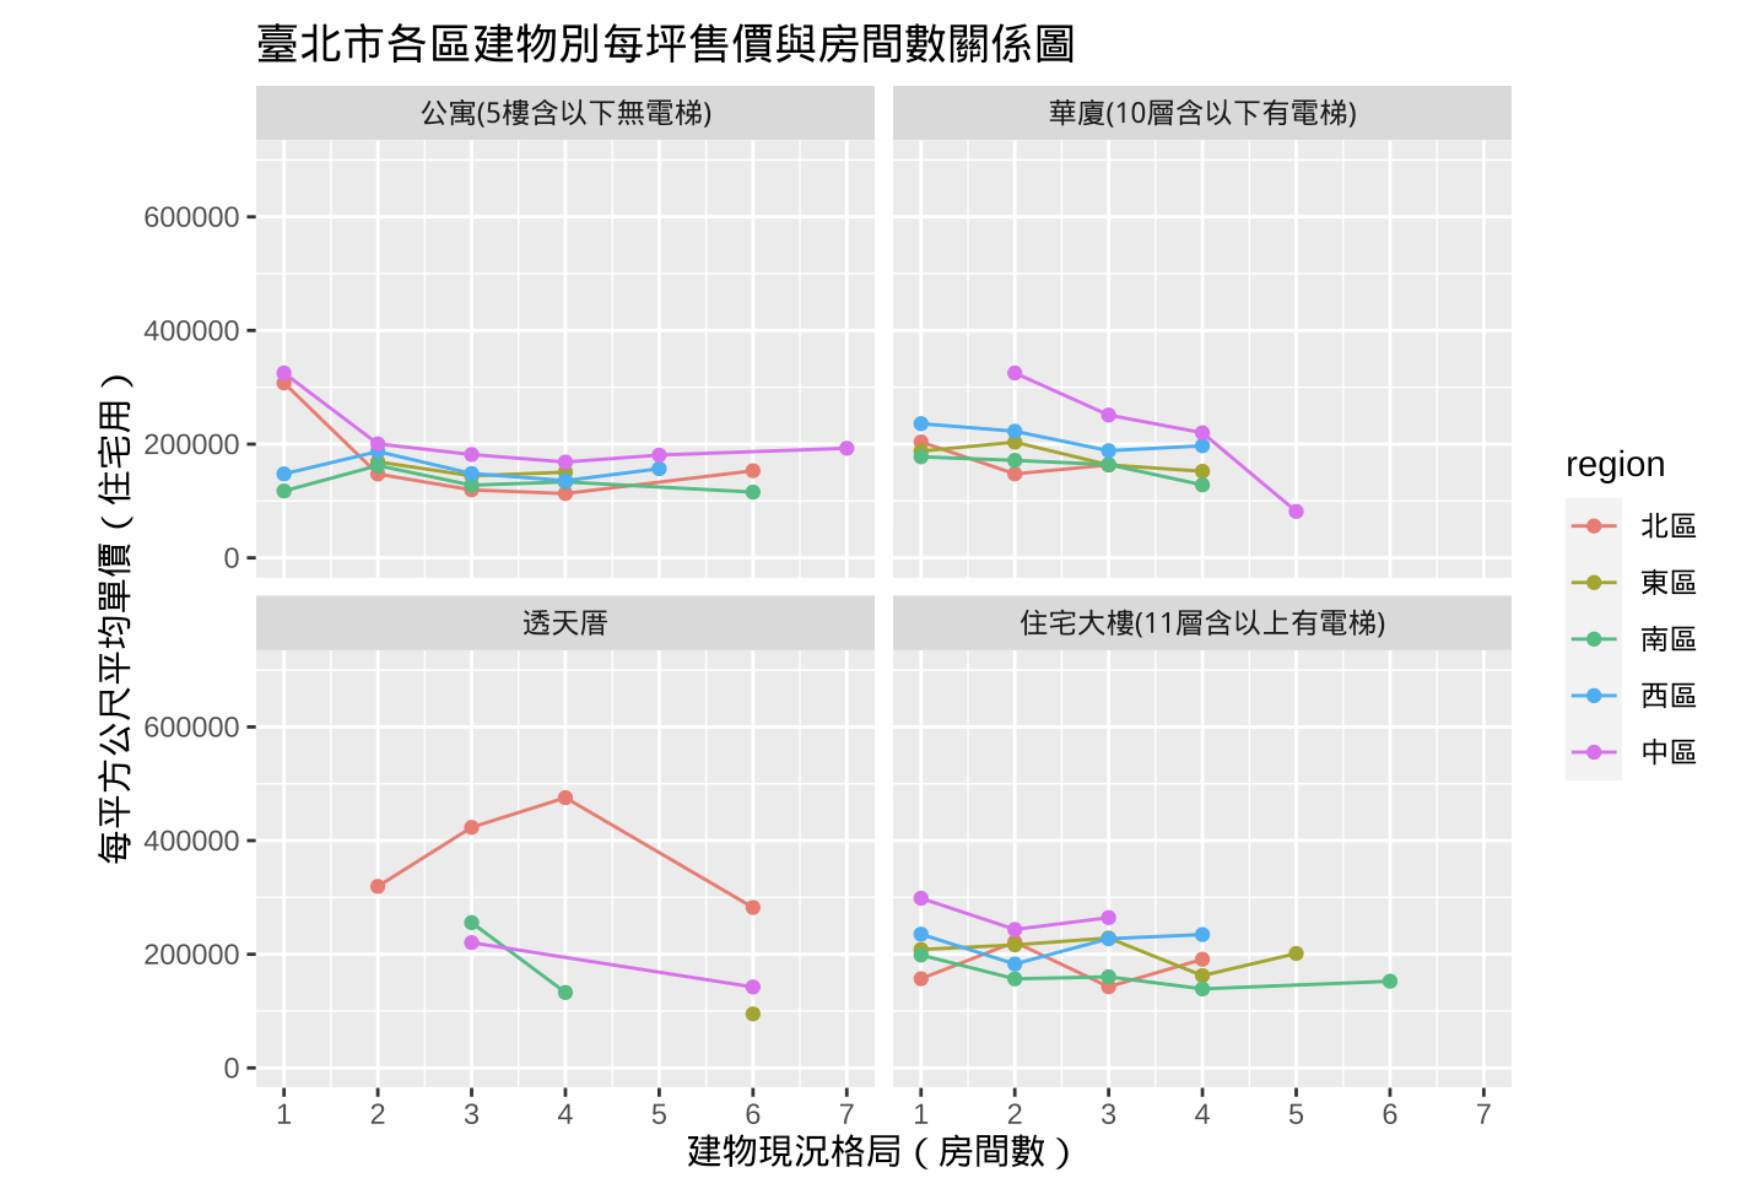
This work use R langauge to code and draw four line charts with relation of number of room to price per units with 4 types of building in different areas in Taipei city, Taiwan, Asia. Overall, in most places and most type of building, the fewer the rooms are, the higher the price per unit is. 4 types of buildings are flat, mansion, house, and tall building respectively.
2021-1 Spatiotemporal Data Visualization - House Price in Taipei City, Taiwan
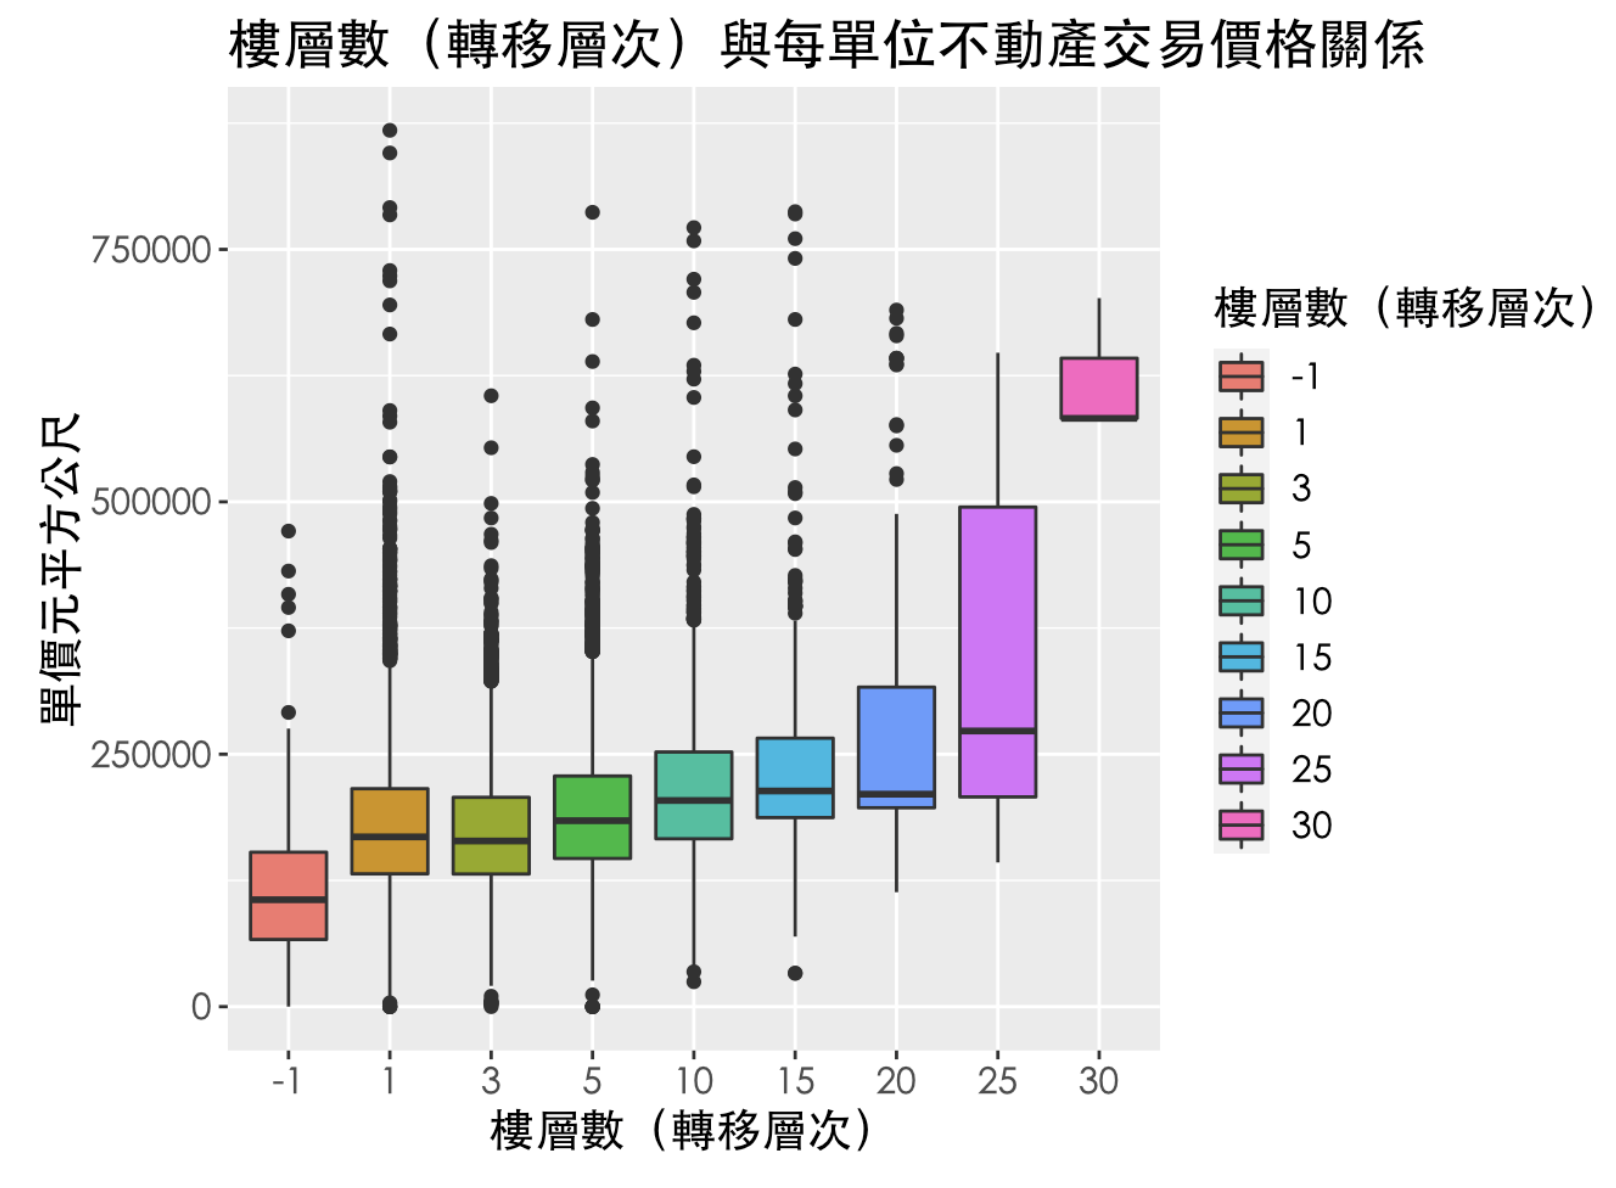
This work use R langauge to code and draw boxplot between which floor the item is and unit price of house in Taipei city, Taiwan. In general, the higher the floor of item is, the higher the unit price is. In another word,the object with higher floor could have higher transaction prices. Among this big picture, 1st floor has relatively high unit price than 2-4th floor.
2021-1 Spatiotemporal Data Visualization - Project 2: Stories and House Price in Taipei
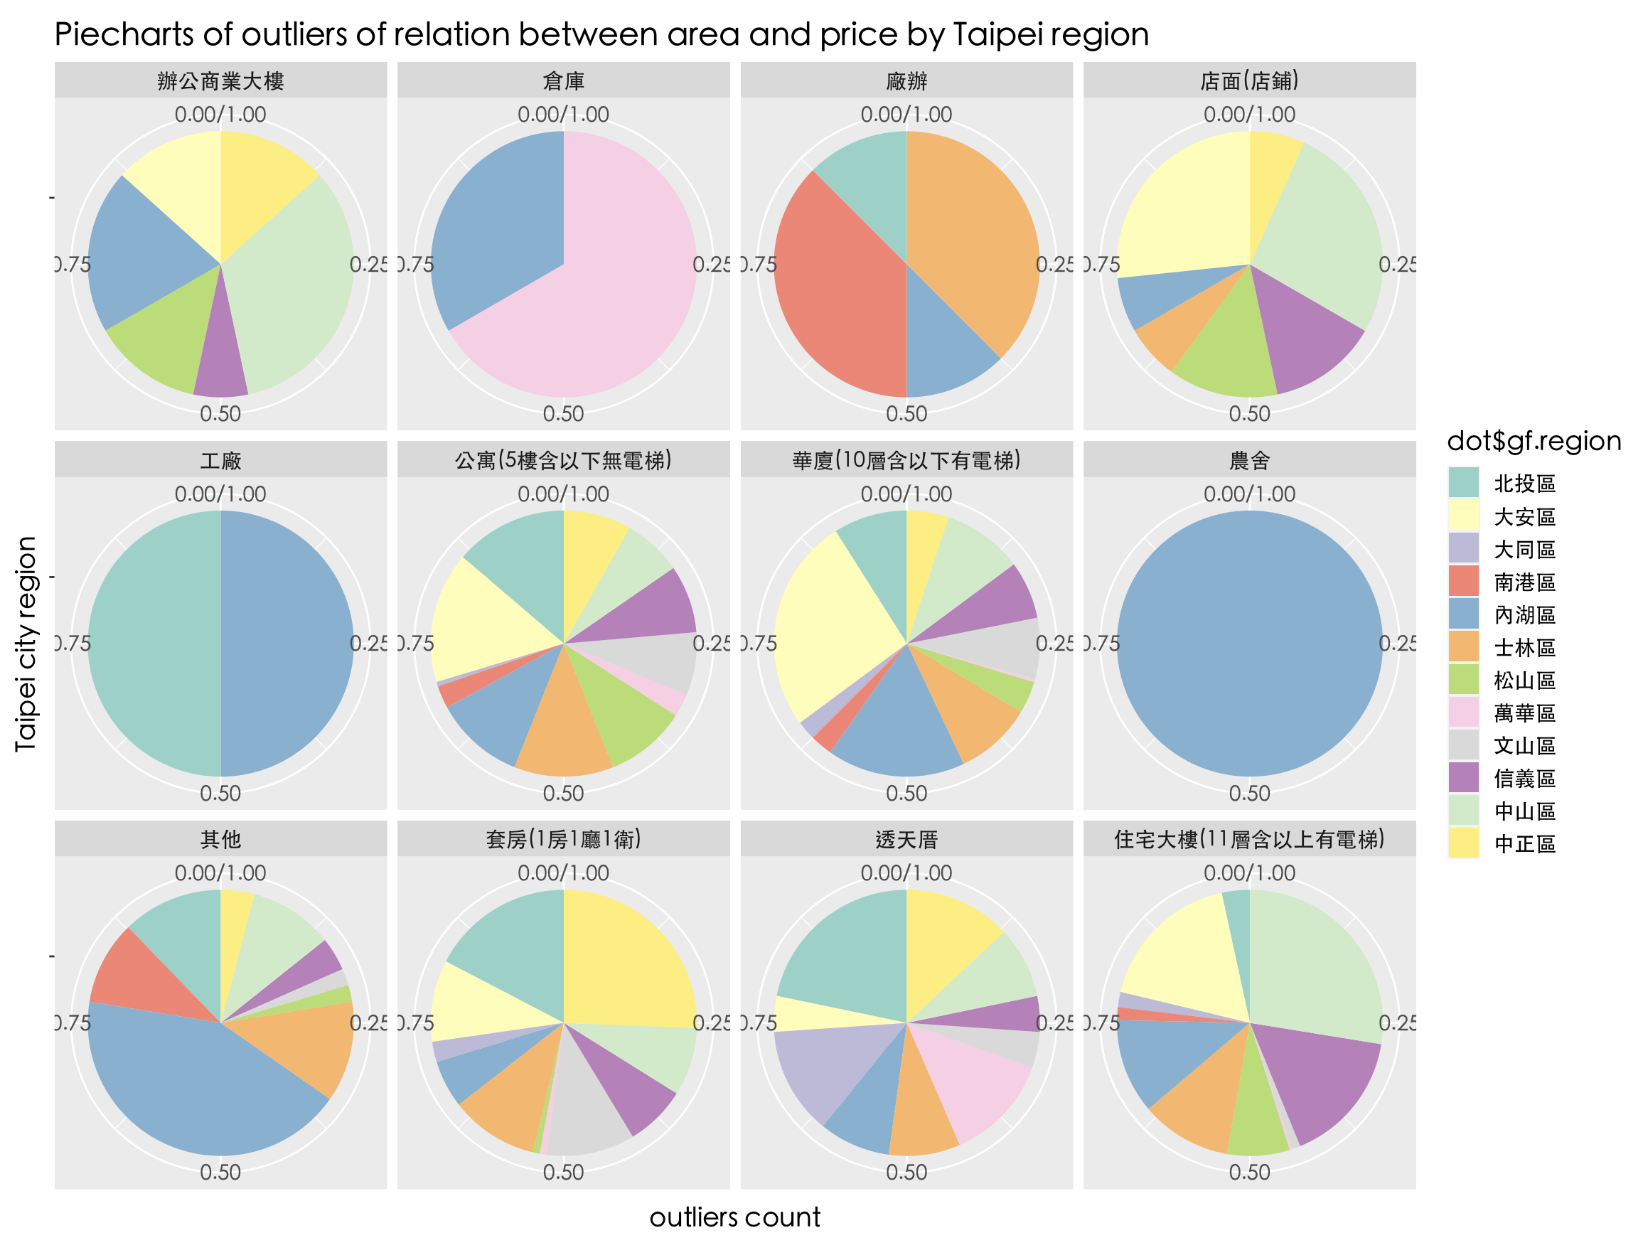
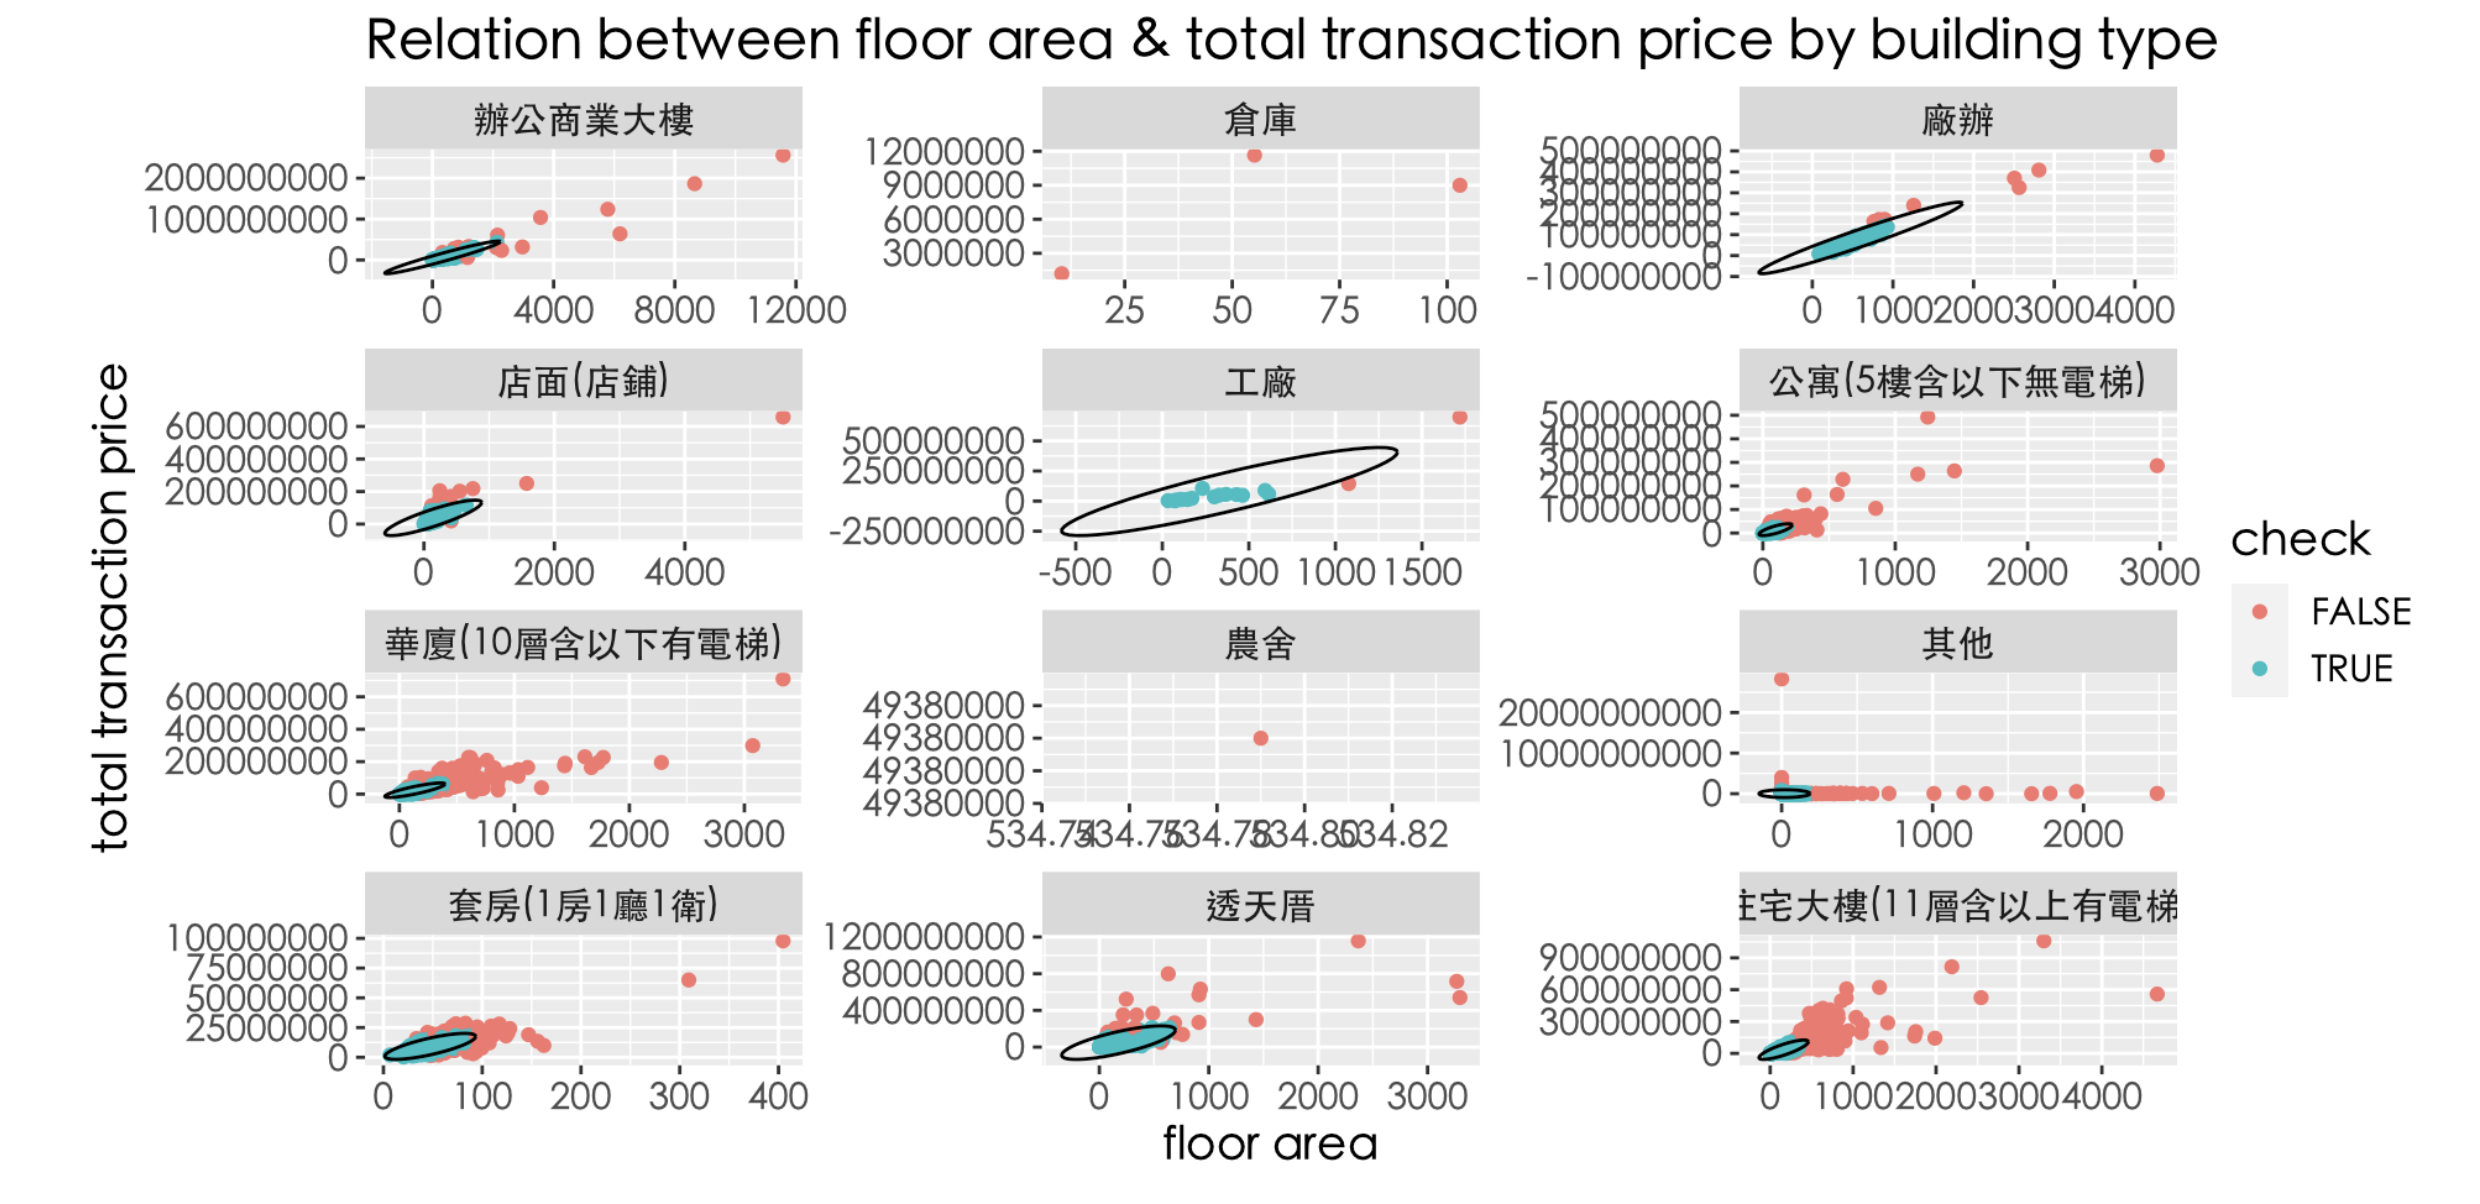
This work use R langauge to code and draw many statistical charts. In this project, I found in house price, the outlier’s geogrpahical variance is the most distinguishable in 住宅大樓,the hot spot is 中山區 followed by 大安區、信義區。 in type of 公寓,hotspot is in 北投區。in type of 套房,hotspot is in 中正區。in type of 華廈,the hot spot is in 大安區 follwed by 內湖區。in 商業辦公大樓,hotspot is in 中山區。in 透天屋,the hot spot is in 北投區。
2021-1 Spatiotemporal Data Visualization - Project 3: Factors of High House Price in Taipei
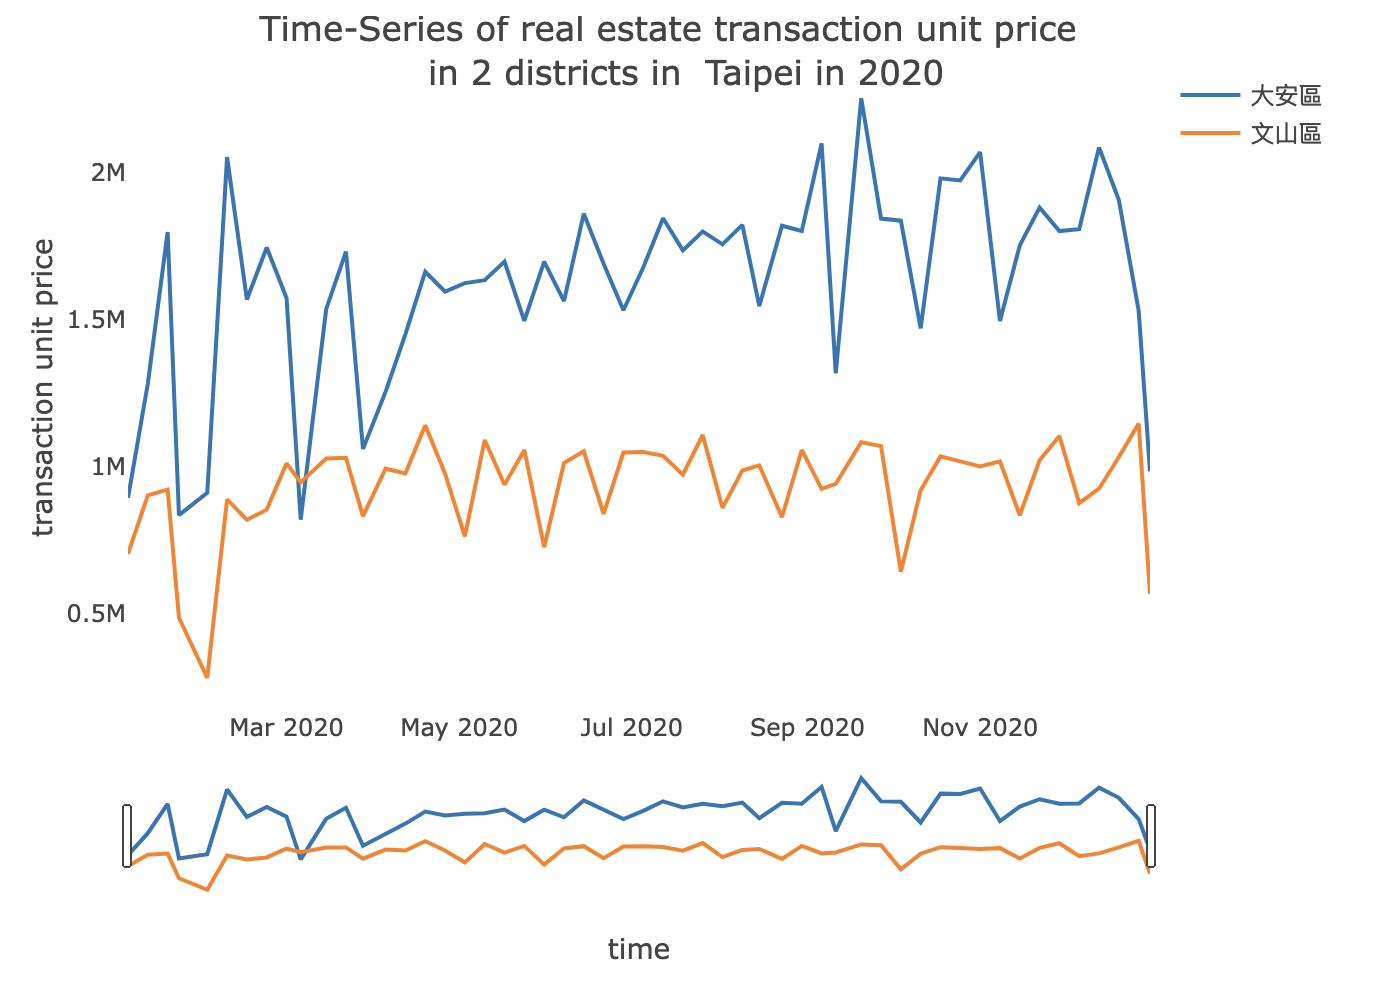
Gerally speaking, Daan district possess higher unit price in real estate transaction in 2020 than Wenshan district in Taipei city, Taiwan. However, during some short period of time, for example, 1st-15th,March, the average unit prices in transaction in Wenshan district is higher the Daan’s ones.
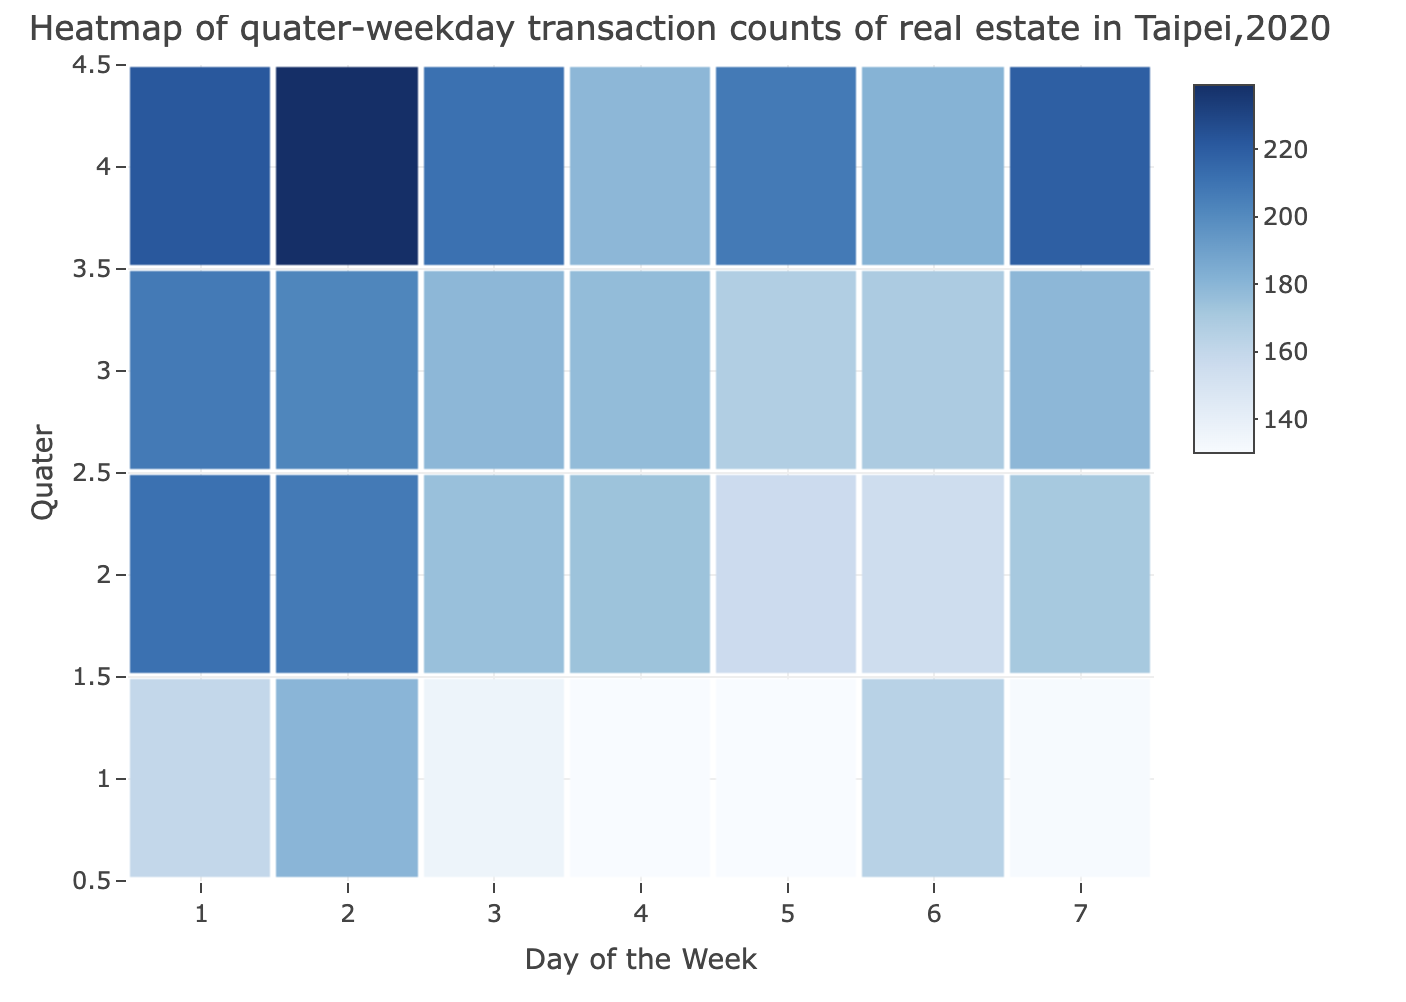
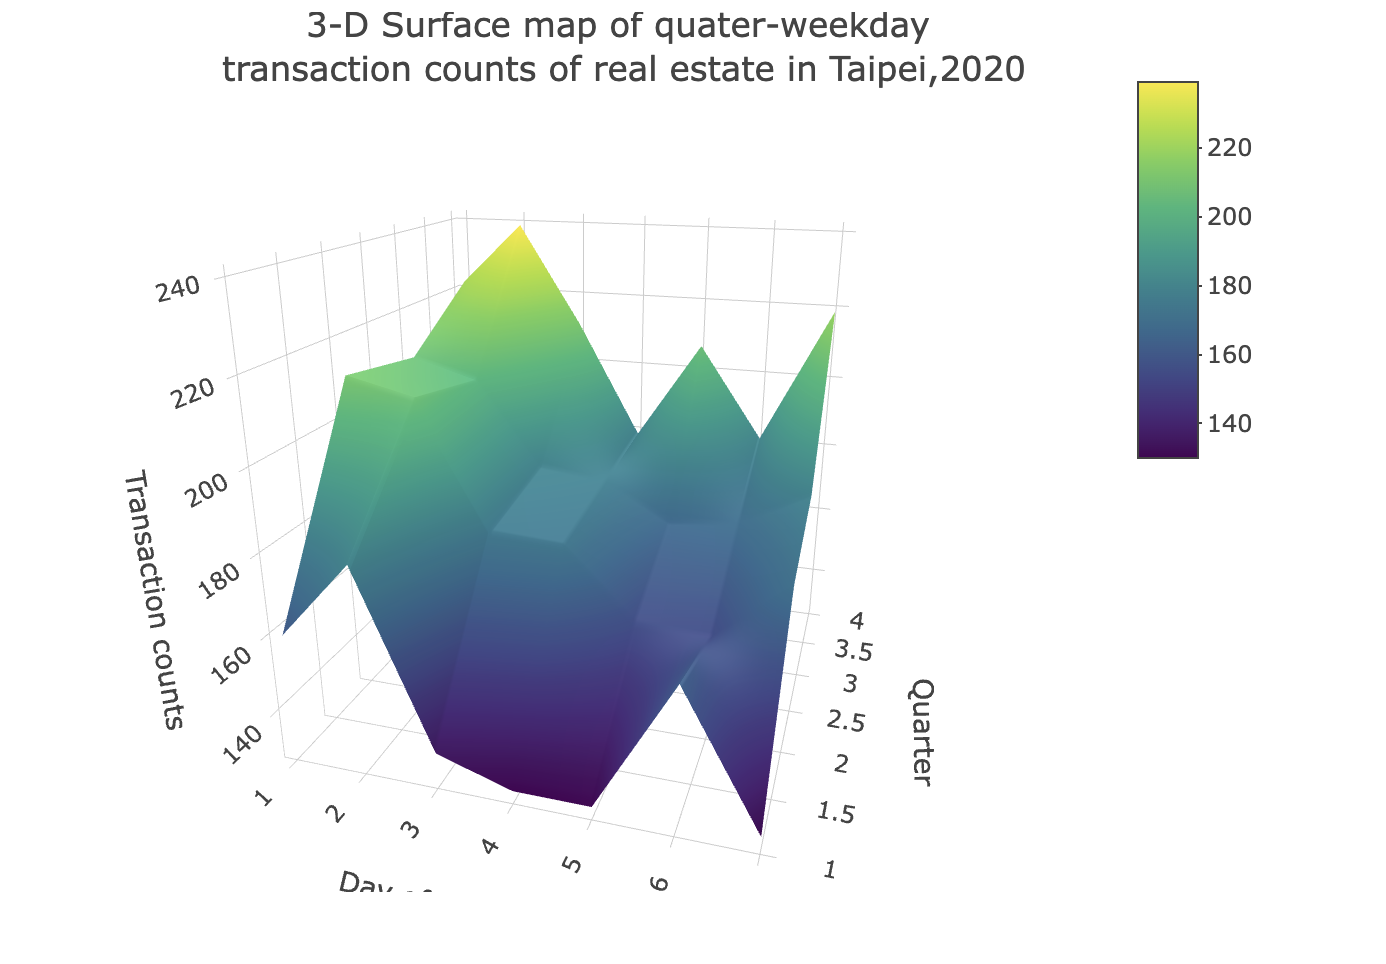
Real estate transaction in Taipei city, in 2020. The 4th quater, which is Oct-Dec,2020, possess higher count of transaction. The transaction has higher frequency occured in Sunday and Monday. This may be something to do the fact that most of people check and consider the house or dealing with real estate agent during weekends (free day). Accordinly, the time-series of transactions of quater and weekday result in this kind of characteristic.
2021-1 Spatiotemporal Data Visualization - Project 4: Time series analysis of House Price in Taipei
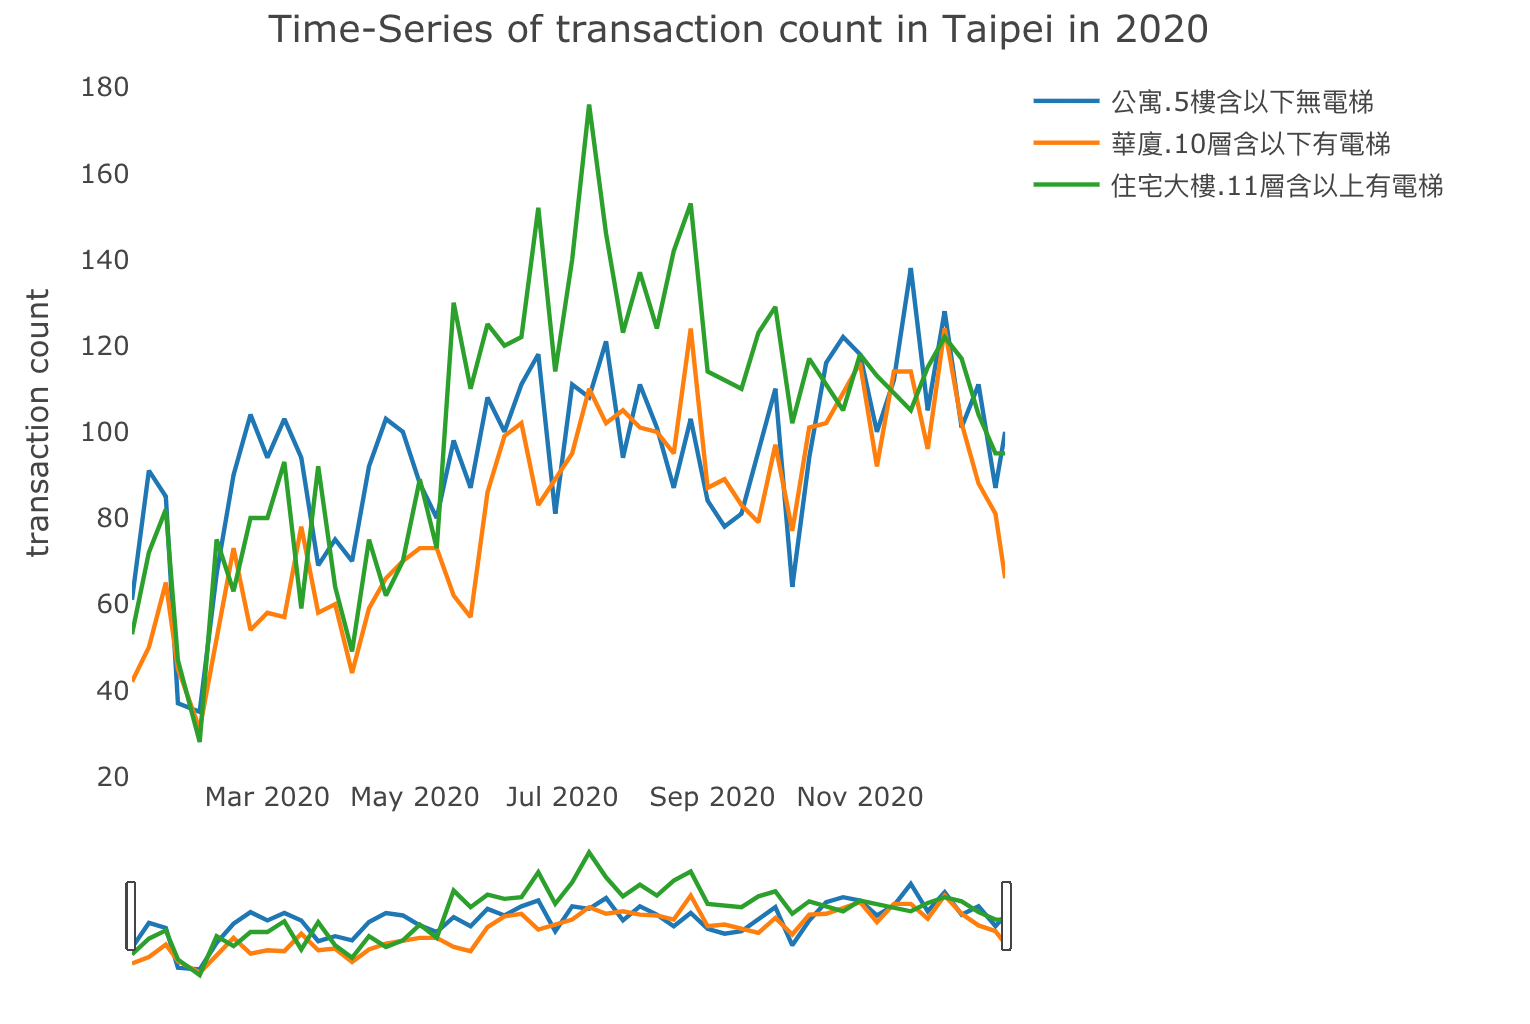
2021-1 Spatiotemporal Data Visualization - Project 4-2: Time series analysis of House Price of different types in Taipei
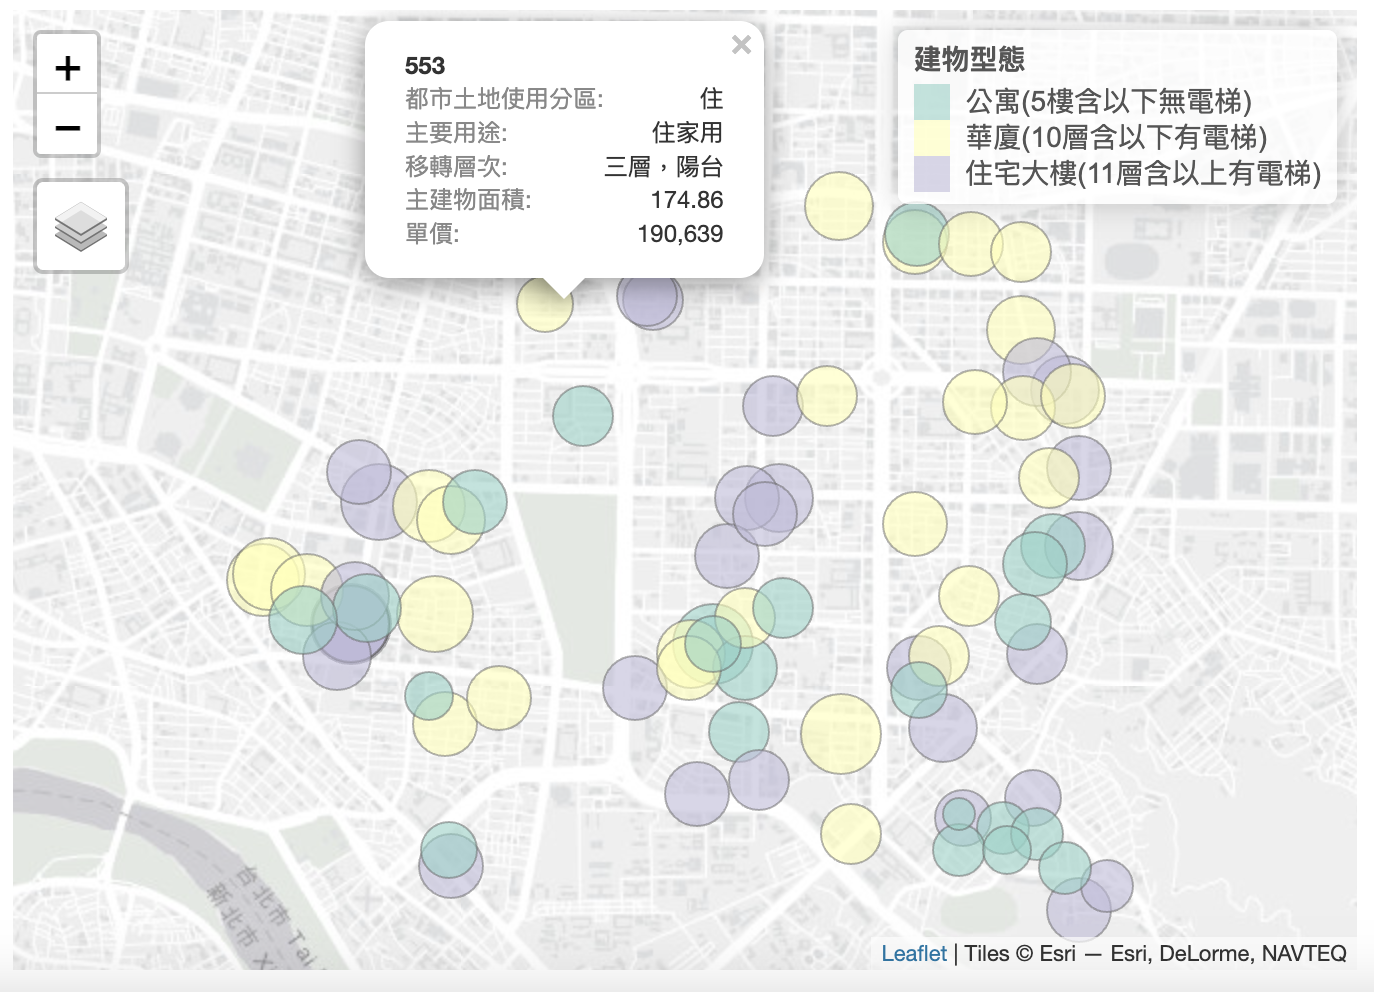
Based on the previous interactive plot, add an interactive popup table to show the attributes of the object, including 都市土地使用分區、主要用途、移轉層次、主建物面積、單價。
2021-1 Spatiotemporal Data Visualization - Project 5: Mapping house market in Taipei
I joined Geographical Information Science Lab in the Department of Geography in National Taiwan University. My academic supervisor is Professor Tzai-Hung Wen, Ph.D.
Any cooperation or suggestion is welcome to me. E-mail is on school system. Phonenumer and the Address is Geography Department of National Taiwan University
Since 7,August 2019 (Wed)